Testing printf over ARM Cortex M4 ITM+SWO line
To compile this program, all you need to do is select the project, and then right-click, and then click on a Build Project.
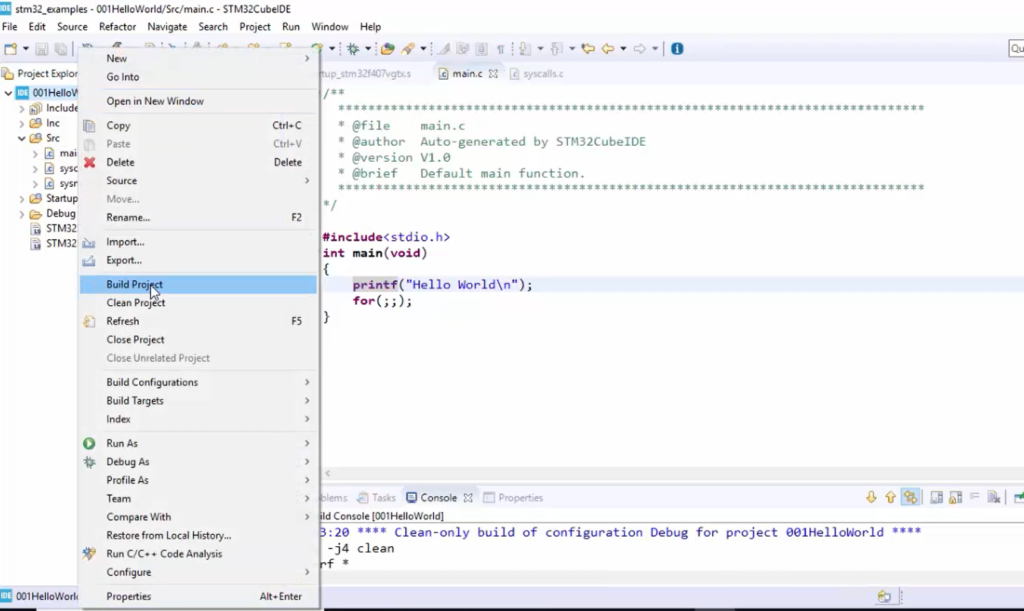
Or you can do another method. Select the project, and click on the Build icon, as shown in Figure 2.
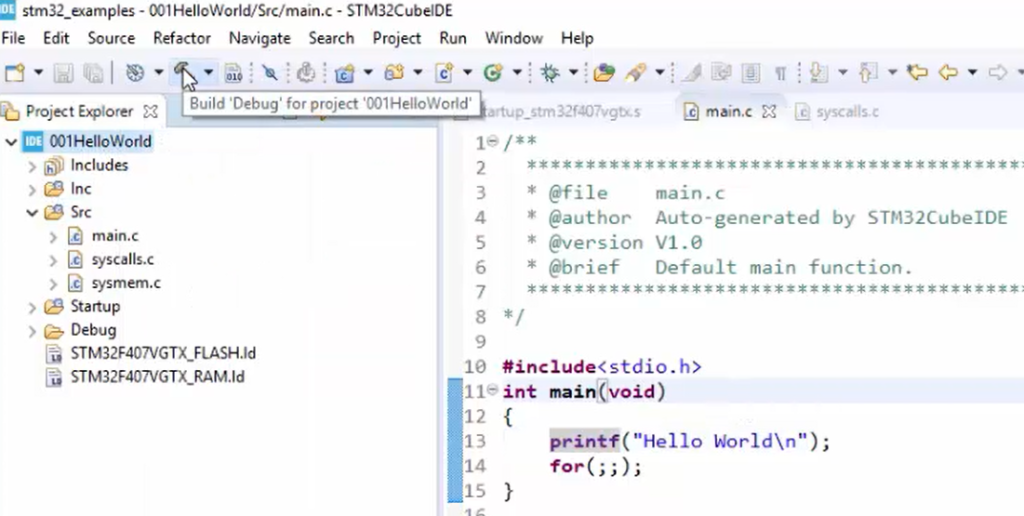
Let’s compile the code.
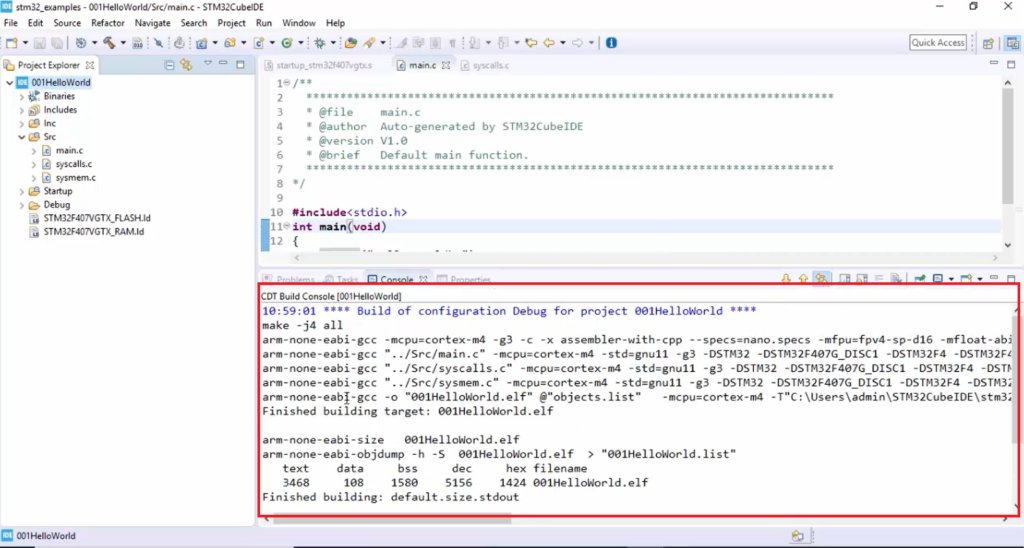
Under the console, you can see the logs. Here, arm-none-eabi-gcc is a compiler invoked by this IDE.
And by the way, you need not worry about installing a cross compiler here. Because all the build tools, cross-compilation tools, everything is installed by the IDE. Everything comes with the IDE, so you need not to install anything extra.
If you want to upgrade this compiler to the newer version, then you may have to change the compiler settings. So, other than that, I don’t think you need to touch any compiler settings as of now. arm-none-eabi-gcc is a cross compiler used to compile this source code for the target architecture.
What is Cross compilation?
Cross compilation means you compile a program to produce code for some other architecture.
For example, in this case, we are using the cross compiler arm-none-eabi-gcc. So, this is a cross compiler. And this cross compiler runs on the host machine, but it produces an executable for a different machine.
For example, the target machine is different; it is based on ARM architecture. That’s why a compiler is called a cross compiler when it runs on one architecture, but it produces the code for a different architecture. So, that compiler is called a cross compiler, and the process is called a cross-compilation.
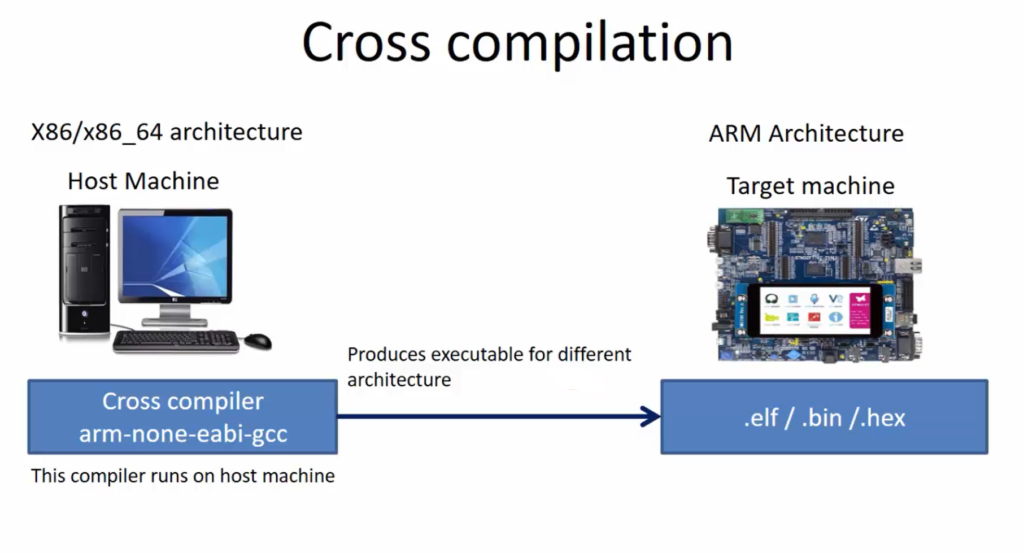
Here, the cross compiler produces different types of executables for the target. These are all the different executable types like .elf /.bin /.hex.
.elf is a type of executable that stands for executable and linkable format. It’s a type of executable which is used for debugging. Because there are tools available to analyze .elf files and they can disassemble the code, and they can get the information about the project.
We will be using the .elf format in this article because we will be debugging our code on the target. Debugging is not possible if you use .bin or .hex. As I said, those are pure binary files, and those are used during production.
What is Native compilation?
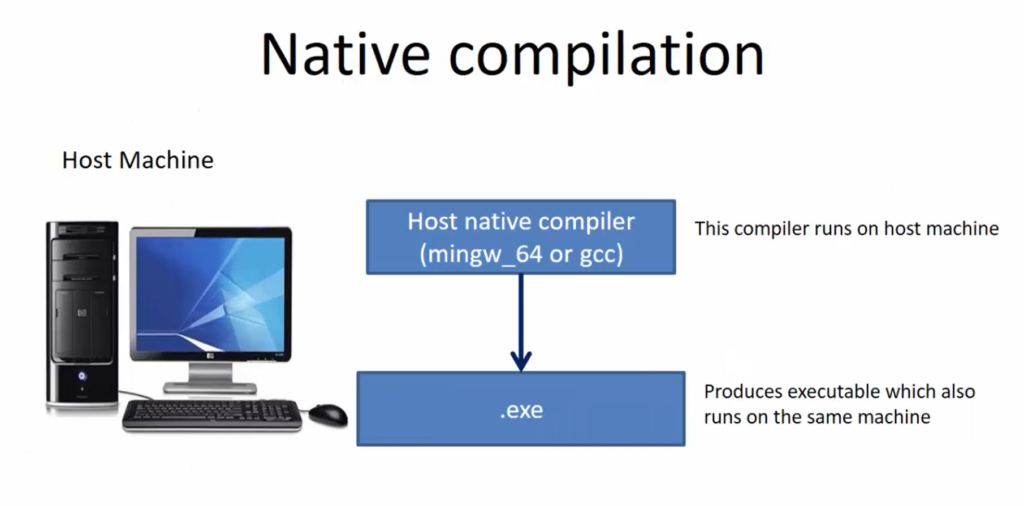
Native compiler means the compiler runs on a host machine and produces executable which also runs on the same machine. This process is called native compilation.
So for, whatever the code that we wrote for our PC that is actually native compilation.
Let’s move forward. Here we actually got .elf of 001HelloWorld project.
After that, we have to load this project into our target now.
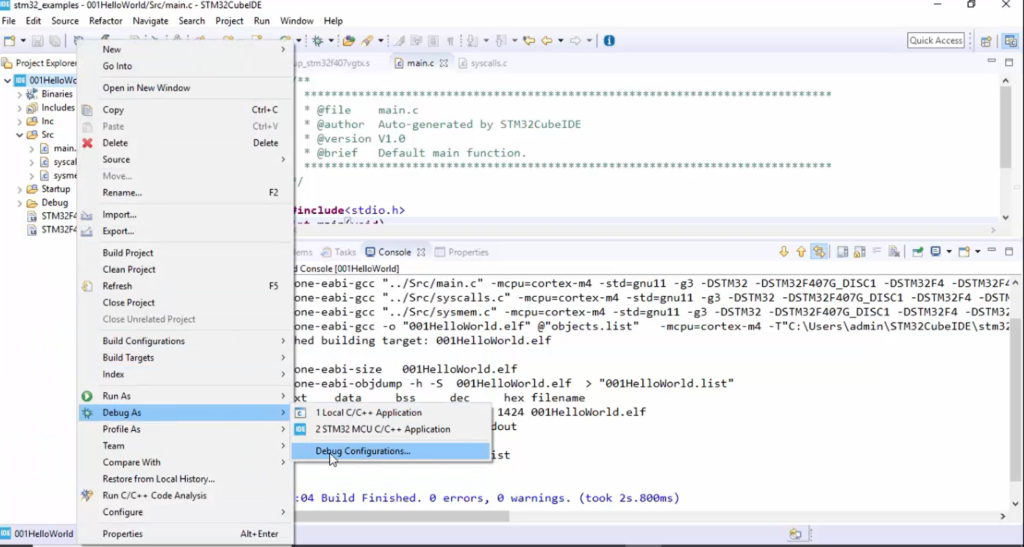
For that, you have first to connect the target to your machine. I’m going to connect the target to my machine, and after that, right-click on the project, go to Debug As, and click on Debug Configurations, as shown in Figure 6.
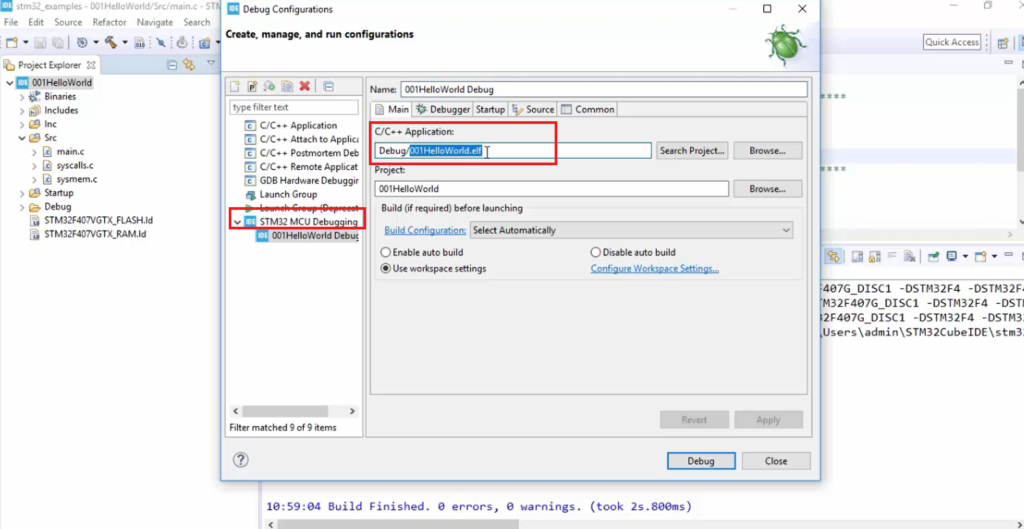
Then, double click on this STM32 MCU Debugging, so it creates a debug configuration here. And so the name you can keep this as it is, no problem. It tries to load this file, that is .elf, which is created during the compilation. And so don’t change anything here.
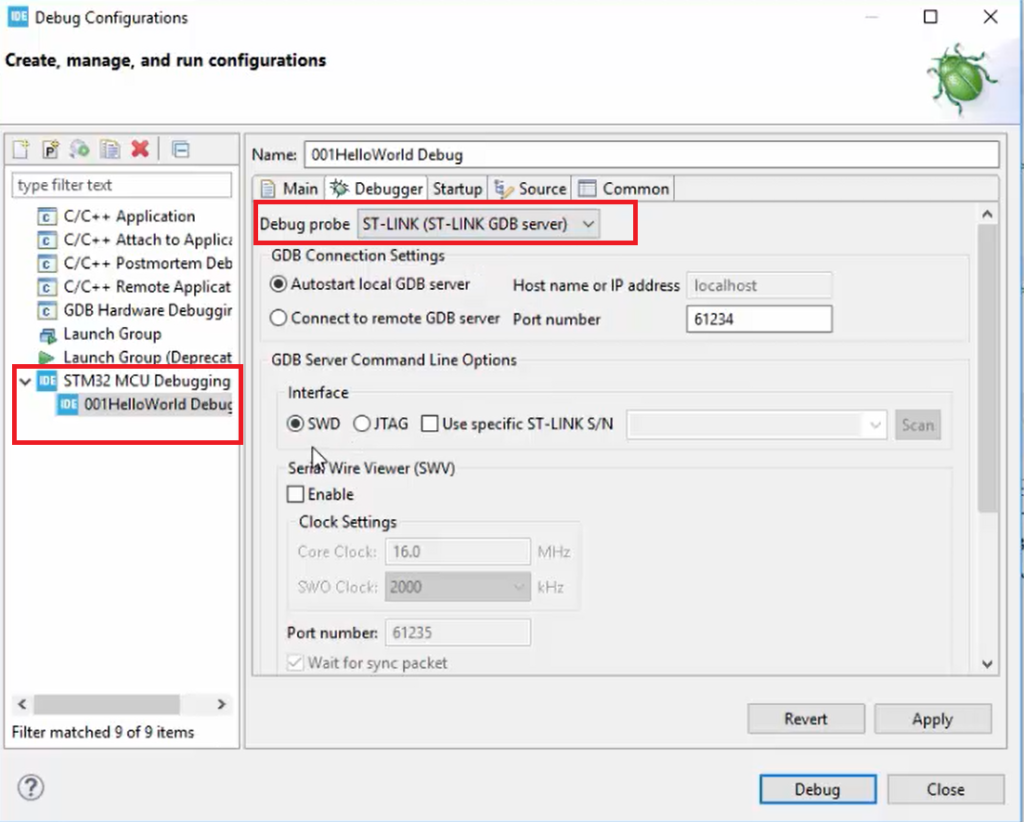
Go to Debugger, and here in the Debug probe, you select ST-LINK(ST-LINK GDB server). So, it also has an option for openOCD, but we will be using ST-LINK.
After that, in the Interface, you select SWD, as shown in Figure 8.
And after that, here is an option for Serial Wire Viewer(SWV). So, enable that. After that, the Core clock is 16.0 megahertz so you can keep that. The SWO clock which is default to 2000 kilohertz, and you can keep that, no problem. And after that, you need not to do anything here.
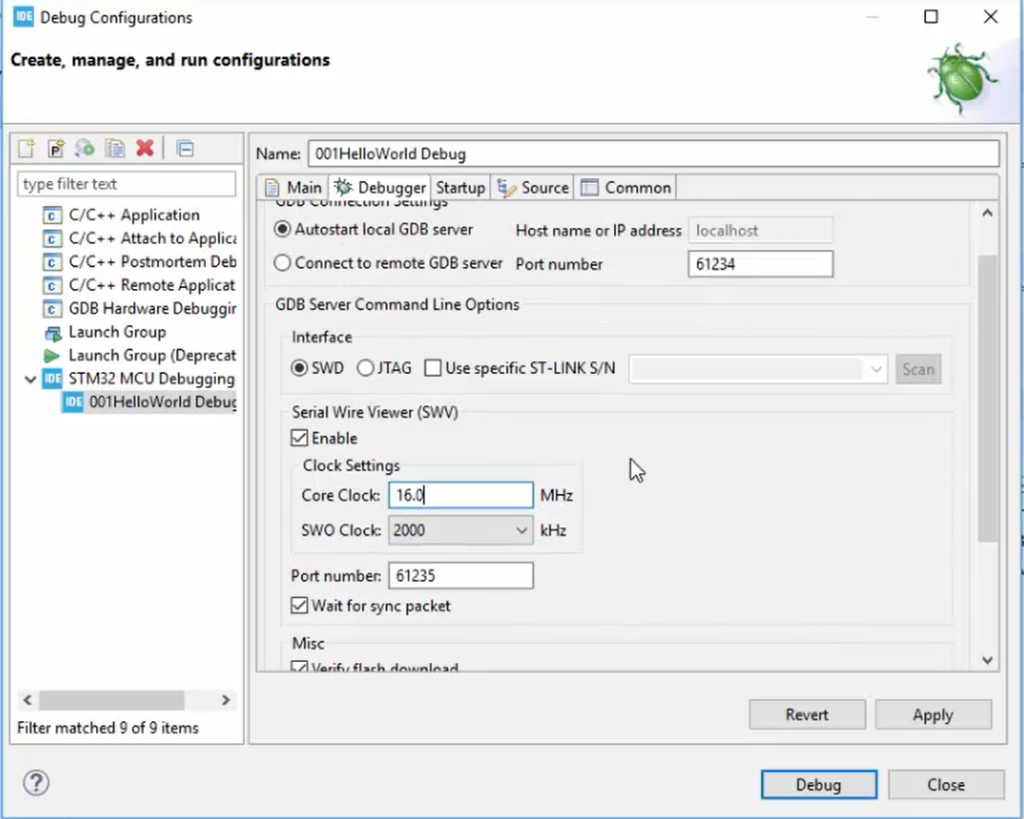
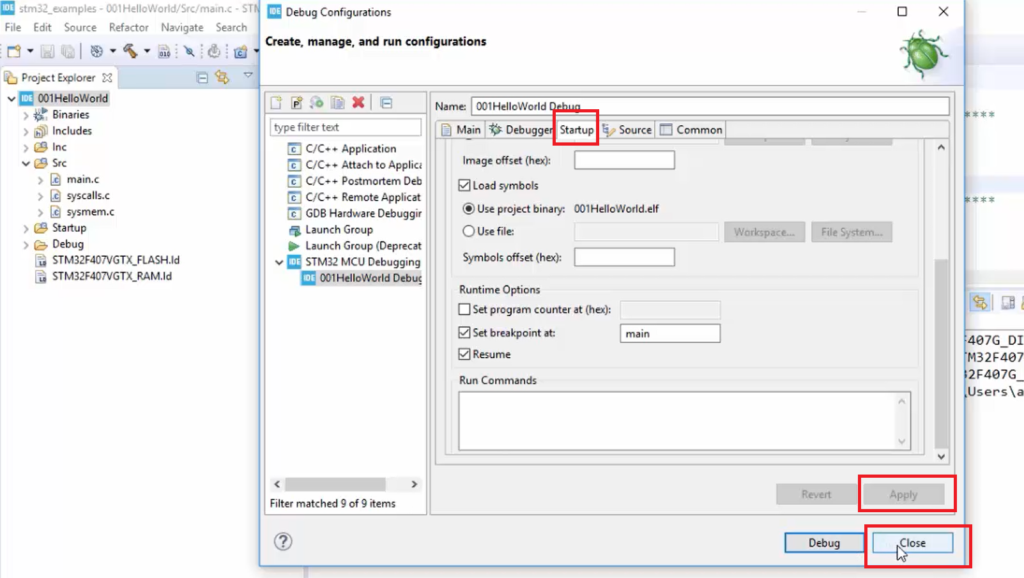
In the Startup, also you need not to do anything. Just click on Apply, and after that, you can click Close, as shown in Figure 10.
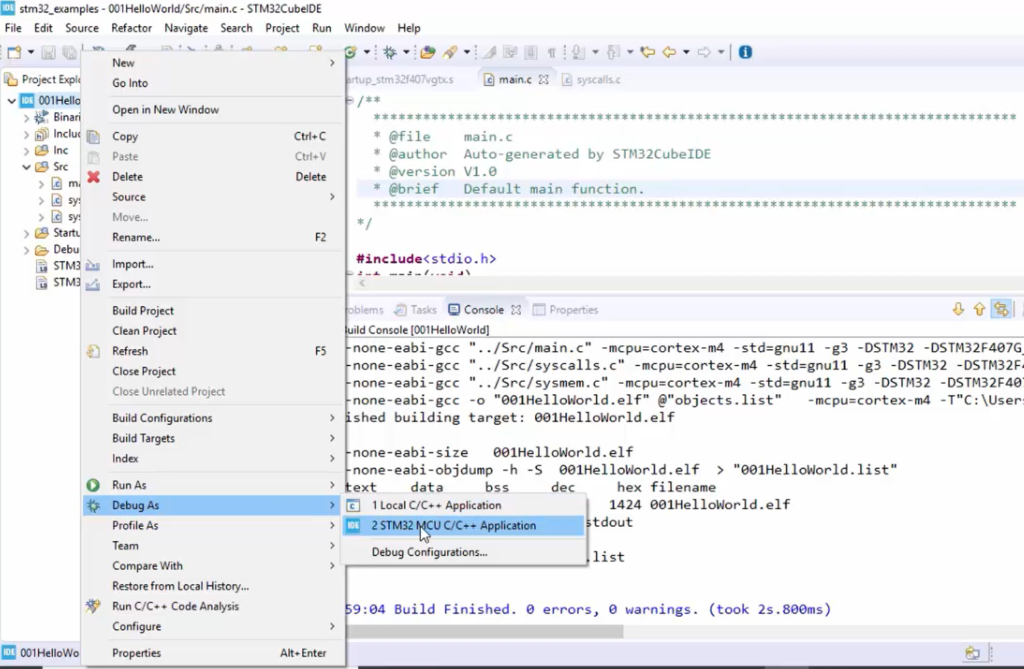
And after that, right-click on the project 001HelloWorld, and you can again go to the Debug As and select STM32MCU C/C++ Application.
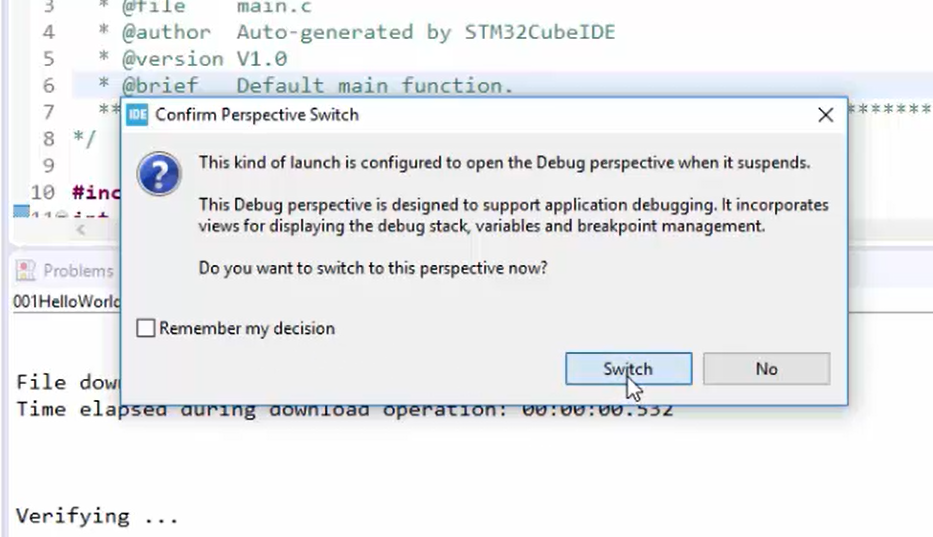
The IDE will load the project into the target hardware, and it will switch into the debug perspective.
The IDE is asking you to change the perspective into debug perspective. For that, you can click Switch.
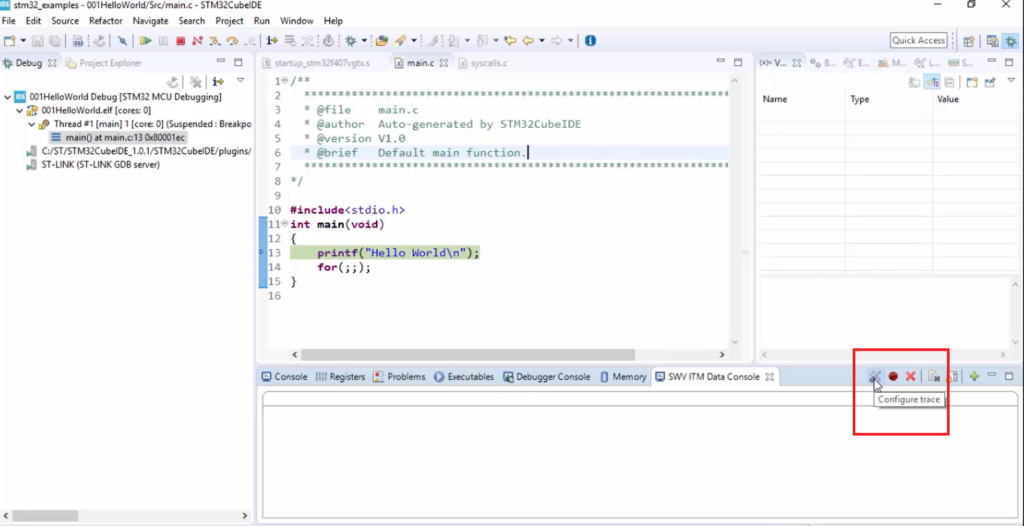
Here you can see that(Figure 13), the code is loaded onto the target, and the execution is stopped at the very first instruction of the main function. This is what IDE is usually do. So, they will halt the execution at the first instruction of the main. The processor is halted because the IDE is stopped here.

How to see this printf?
For that, you have to go to the Window, go to Show View, go to SWV( that is serial wire viewer), and then go to SWV ITM Data Console. Click on that.

It will appear at the bottom of the SWV ITM Data Console. And then, click on this Configure Trace here, as shown in Figure 15.
Select Port 0, and after that, click on OK.

Let’s run the code. To run the code in one go, you have to click the Resume button.

After clicking the Resume Button, actually, you didn’t see that message here. That’s because you have to start the trace. Now, let’s reset the board.

You can reset the board from IDE itself; you need not to keep pressing the reset button of the board. You can do that from here, click on Reset the chip and restart the debug session. Let me reset.
Now let’s click on the Start Trace button here. After clicking the button, SWV ITM Data Console is ready to accept data on the SWO pin.

Then, let’s hit the Resume button. Here we got the “Hello World” message as shown in Figure 20.
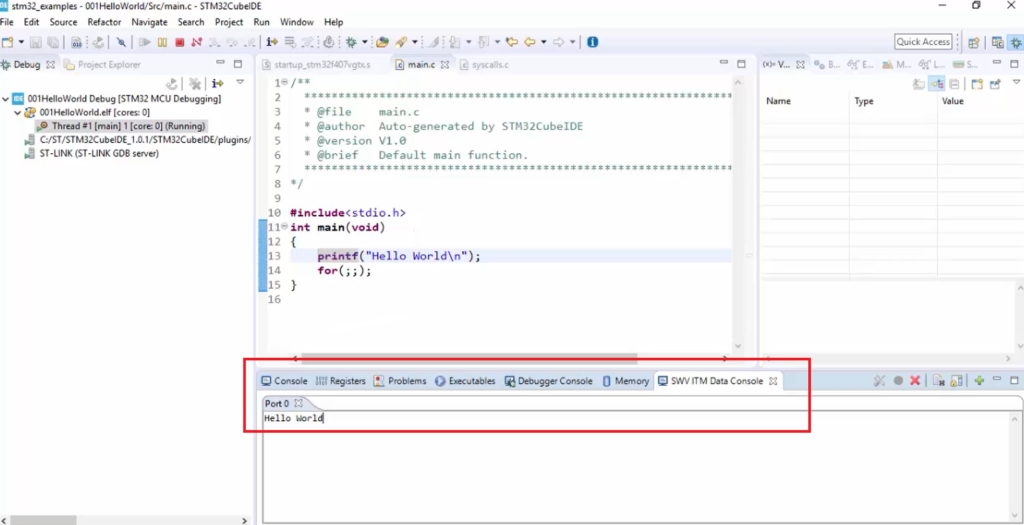
What’s happening here?
Printf is going to standard library, from standard library, it is coming to the write function, and in the write function, it is going to the ITM FIFO, and from that ITM FIFO, it is coming over SWO pin all the way back to the IDE.
And for any reason, if you are not able to use SWV(serial wire viewer), then you can use semihosting using the openOCD debugger.
FastBit Embedded Brain Academy Courses
Click here: https://fastbitlab.com/course1

