Disassembly
In this article, let’s understand about Disassembly feature of the IDE.
What exactly is disassembling the code?
If you check the dictionary meaning, disassemble means translate from machine code into a higher-level programming language.
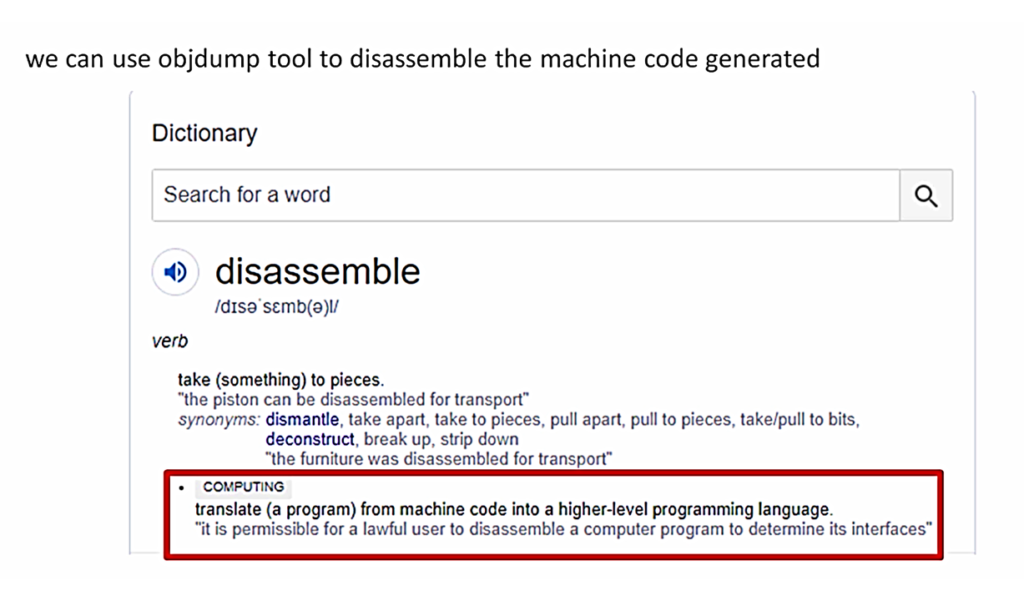
In our case, disassemble means we have a tool called Object dump. We take that tool, and we run that on the executable file what we generated, that is .elf file. And we can get back the assembly instructions generated for the program what we have written. This will be helpful when you want to carry out Instruction level debugging.
That means if you want to see what are the processor instructions generated for the code we have written. And if you want to understand how exactly the control is passing from one part of the program to another part of the program, and if you want to check whether there is any room for optimization at all. You can do the instruction level debugging using a disassembly feature.
The IDE also gives you a disassembly window from which you can observe the instructions generated. The IDE also does the same, so it also runs the objdump tool internally on the elf file.
Let’s go to the IDE and see how to get the disassembly feature. Now, once you are in debug mode, what you have to do is, you have to go to Window, Show View, and click on Disassembly.
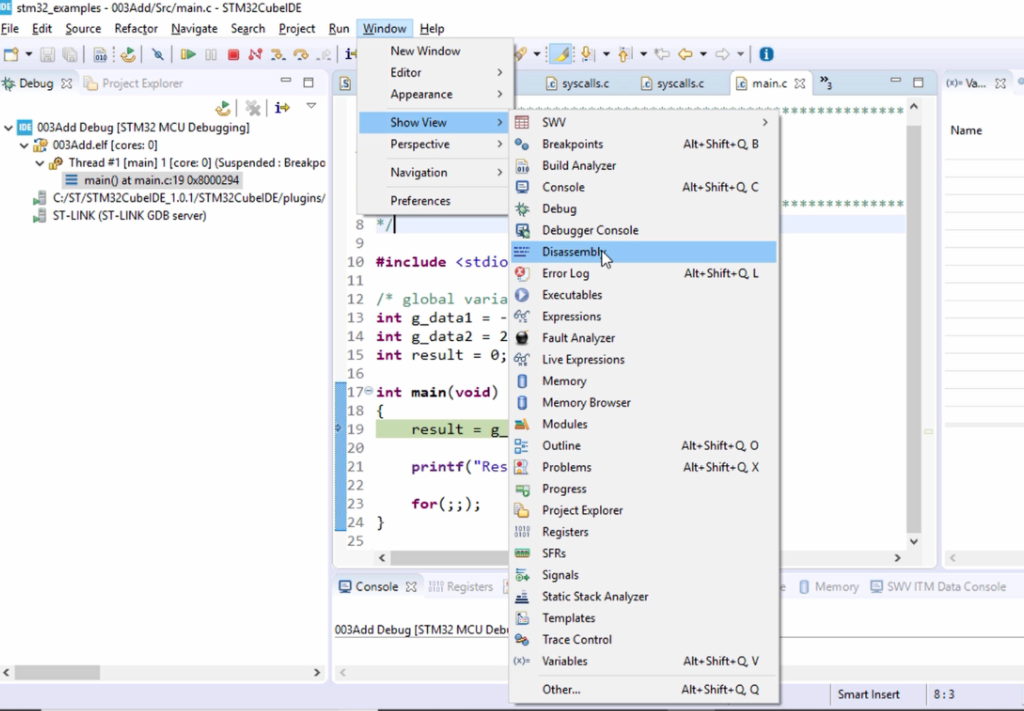
It is as shown in Figure 3.
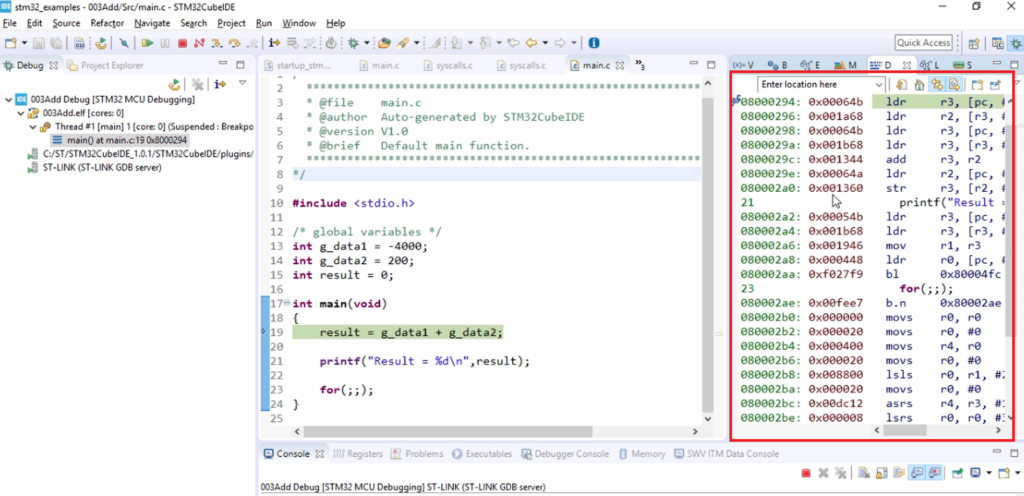
These are the instructions generated for our code. All these are ARM instructions, or strictly speaking, these are Thumb-2 instructions of the ARM instruction set architecture.
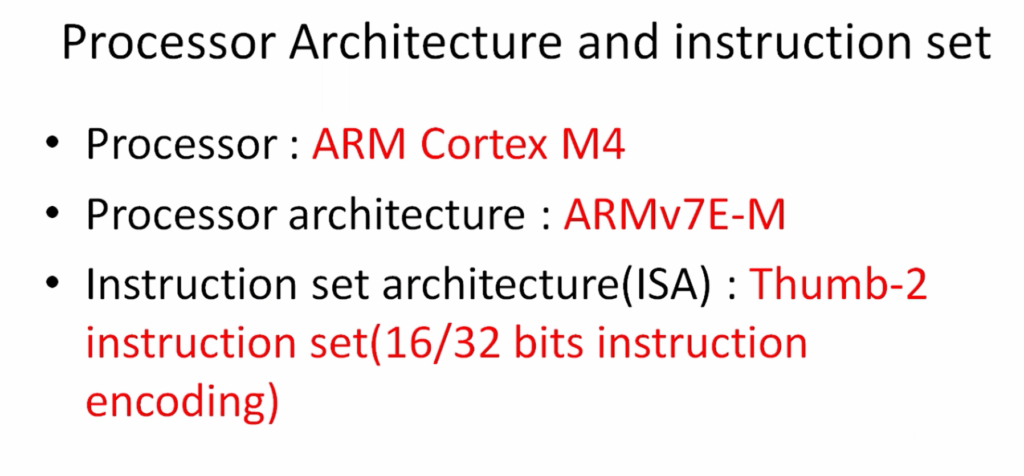
Please note that the processor we’re using here is ARM Cortex M4, and the processor architecture is ARMv7E-M. That’s an architecture name for the processor. This architecture uses ISA(Instruction set architecture) designed by ARM, and the instruction set architecture name is Thumb-2, a collection of 16 and 32 bits instructions.
These are the ARM instructions which are generated for our main function. We check the code here(line 19). This is a case of a read, modify, and write, as shown in Figure 5.
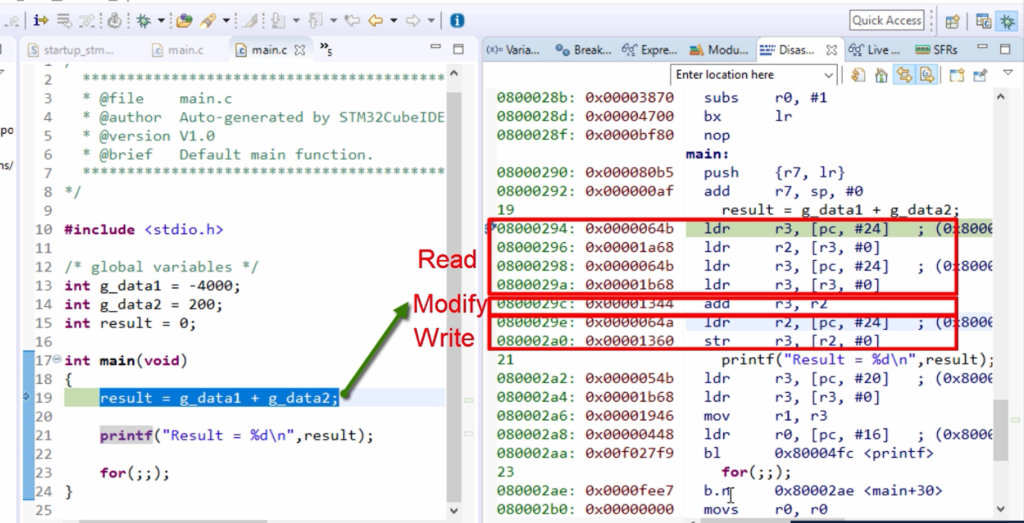
You observe the equivalent assembly code here. Blue color characters are the assembly mnemonics, Brown color characters are the opcodes, and Green color characters are the location where the opcode is placed for this instruction mnemonic.
If you observe this, it has a collection of load and store instructions. First, the data is read from the memory locations into the processor registers by using load instructions.
The Read, Modify and Write case of our code(line 19) takes place as shown in Figure 5. Read case is reading from memory location to the processor registers. After that, Modify the case of operation Add. So, two registers are added, and the result is placed in the register r3. And after that, this is write back to the memory location. Now the content of the r3 is written back to the memory location.
If you cannot see this opcode, you right-click here and select this Show Opcodes.
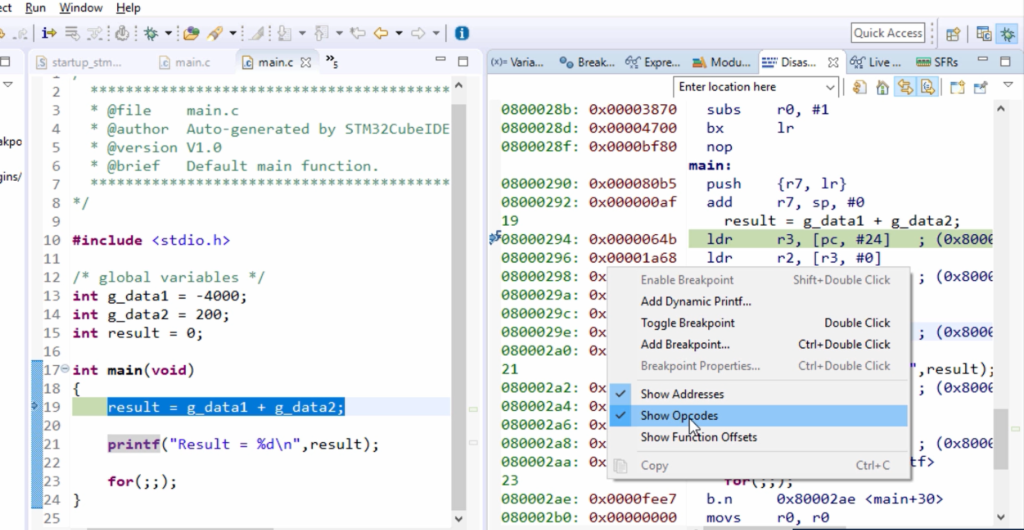
And here you can see that, even though we have written only this much opcode, the disassembly shows lots of code because you have called printf here, which includes codes from the standard library. So, because our project also uses a standard library.
You can also check this disassembly using the objdump tool on your .elf file. For example, run the command arm-none-eabi-objdump.exe.

And you can use the argument -d. That is, disassemble—display assembler contents of executable sections.
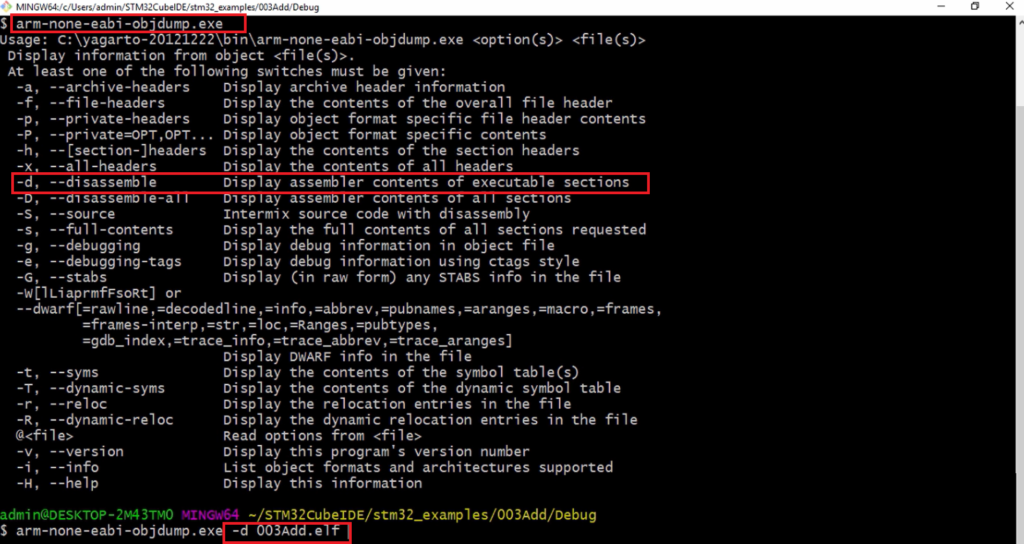
I run that command -d 003Add.elf. Look at Figure 9; it disassembles all the code sections and gives you the assembly code generated.
There is a lot of code. Even though your program looks very simple since you have used to printf, all these codes from the standard library are included.
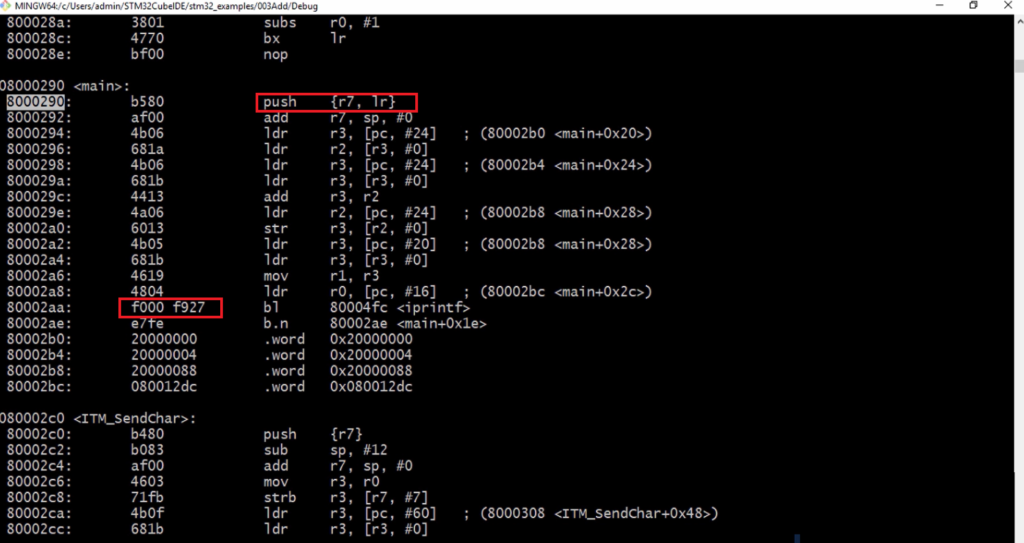
Our main code is right here. Our main code starts at this location 8000290 in the program memory and push {r7, lr} to be the first instruction of our main function, and you can see that most of the instructions are of 16 bits.
And since it uses Thumb-2 instruction sets, some instructions also of 32 bits. For example, instruction f000 f927 is a 32 bit instruction. So, if you want to explore more about Thumb-2, please go to the ARM website and explore about the Thumb-2 instruction set architecture and the discussion is completely out of the scope of this article.
That’s about the disassembly, so use it whenever you want to do instruction level debugging.
I want to debug what exactly is happening at this line of code → result = g_data1 + g_data2;
So, I would just put two breakpoints. Just double-click over that blue strip and put the breakpoint. You can see that on the right-hand side of the disassembly window, there are also two break points got inserted.
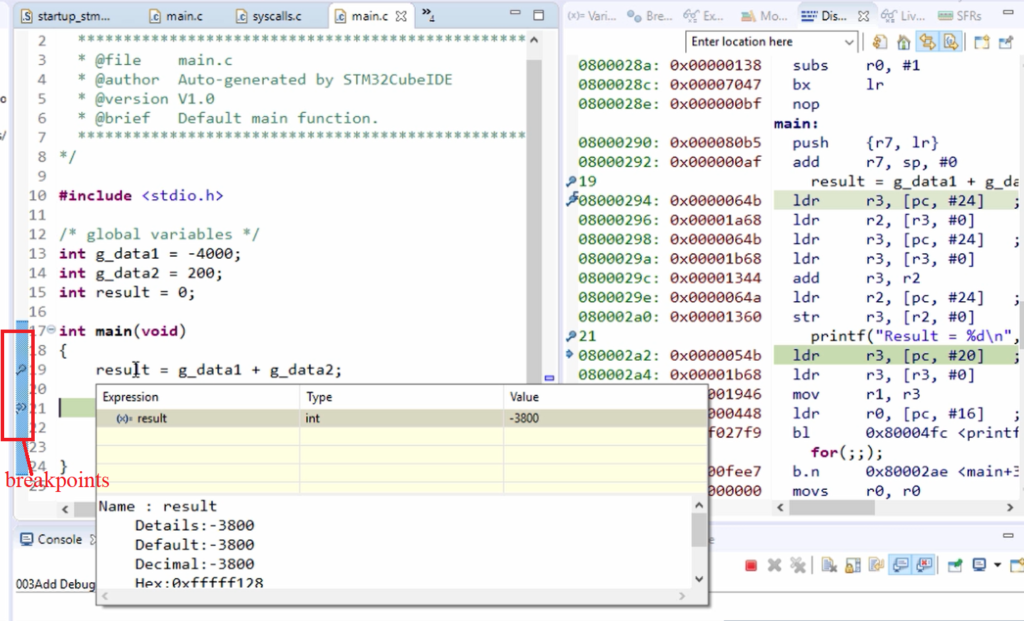
If I run the code, you can see that all these instructions run, and I got the result. So, the result is this much, as shown in Figure 10.
But, if you want to do Instruction level debugging of that line, then you have to insert breakpoints in the disassembly window. Let me reset everything.
I want to see what exactly happens in these two instructions, 0x0000064b, and 0x00001a68. I would put a breakpoint here(Figure 11) and then run the code. And now, let me check the register r2 because that was the affected register.
Let’s check the registrar r2. Now, let’s go to the Registers, r2. And here, you can see that, so the value from the data memory is read and placed into the internal register r2. So, that is -4000.
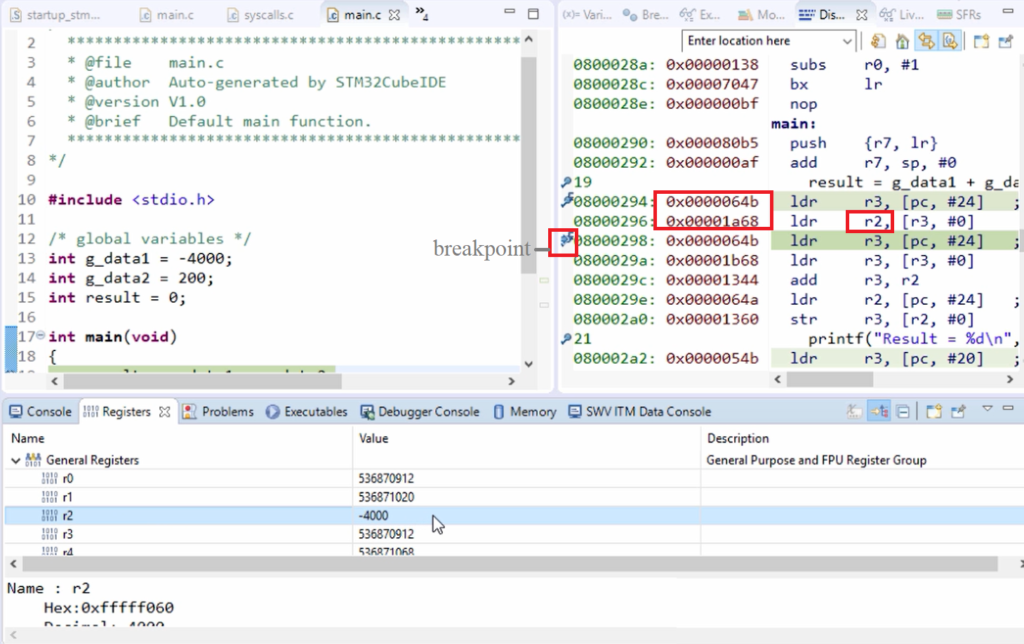
Now, let’s change the format to hex. From r3 (an address), the value is read and placed into r2.
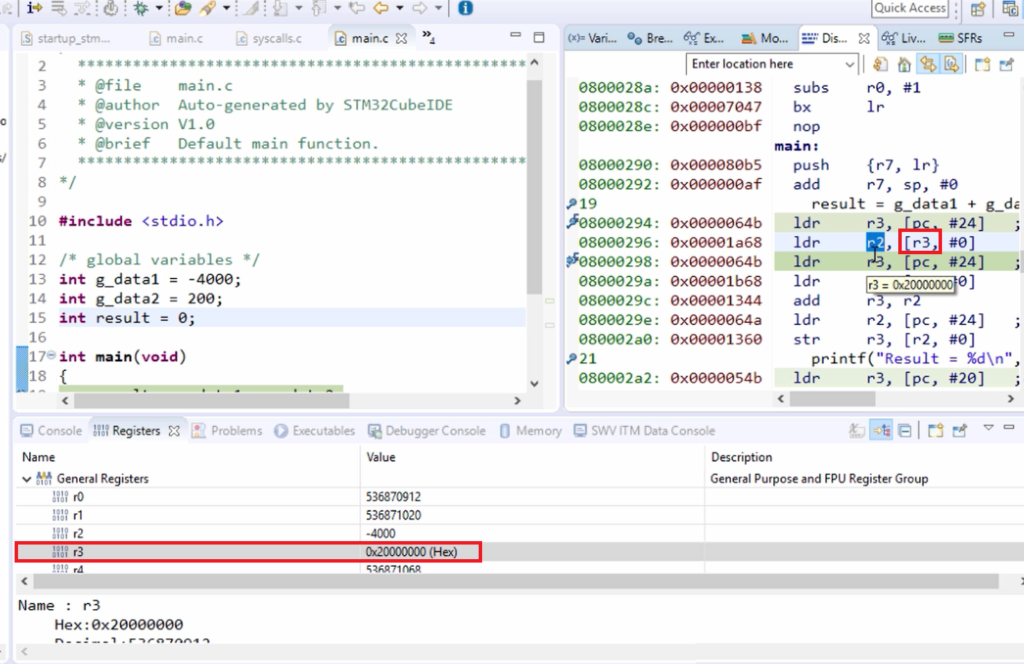
And after that, what happens if r3 is loaded with another address? Let’s see what that address is. Remove the breakpoint in the first line and place the breakpoint here in the following line and run. And r3 content is now changed to this value 0x20000004 to fetch the next value.
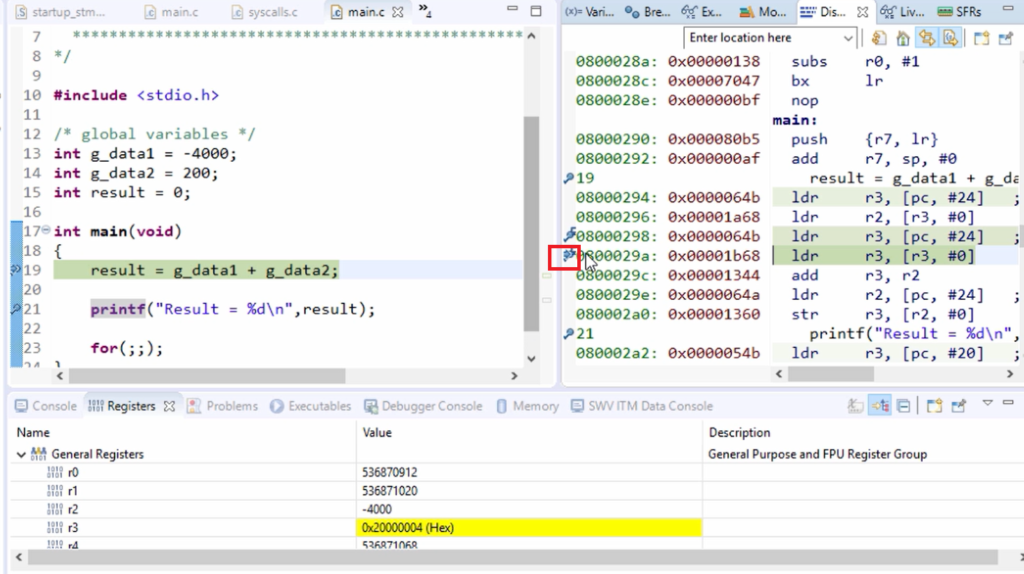
After that, let me put the breakpoint in the following line, and let’s run. And here we can see that now r3 contains 0xc8, which is nothing but 200. So now, r2 has -4000, and r3 has 200. After that, add is executed.
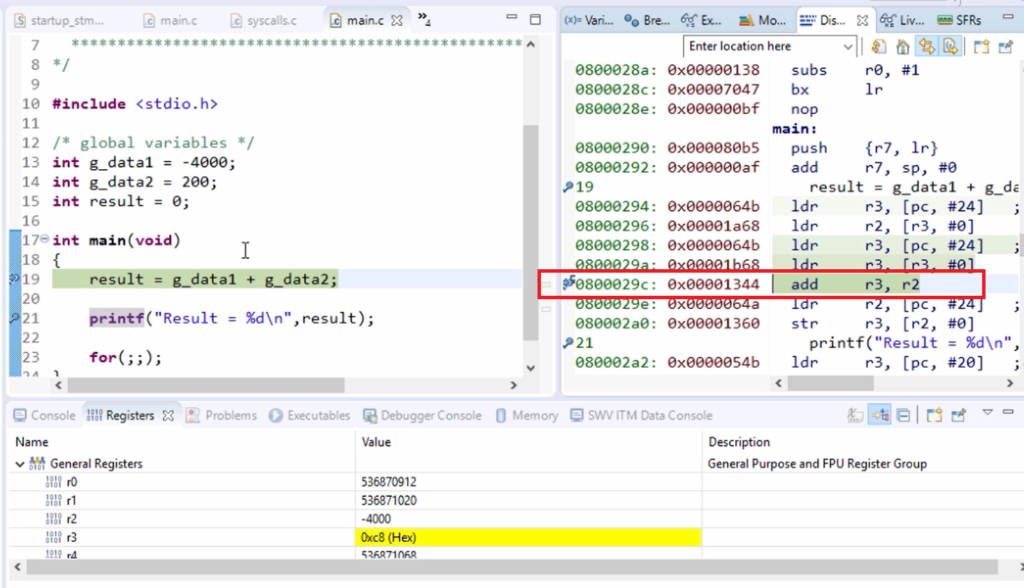
Let me keep a breakpoint in the next line, and let’s run. You can see that add is executed, and the result is placed in the register r3. The result should be written back to the data memory to the variable result. That’s why, for that, r2 is loaded with an address.
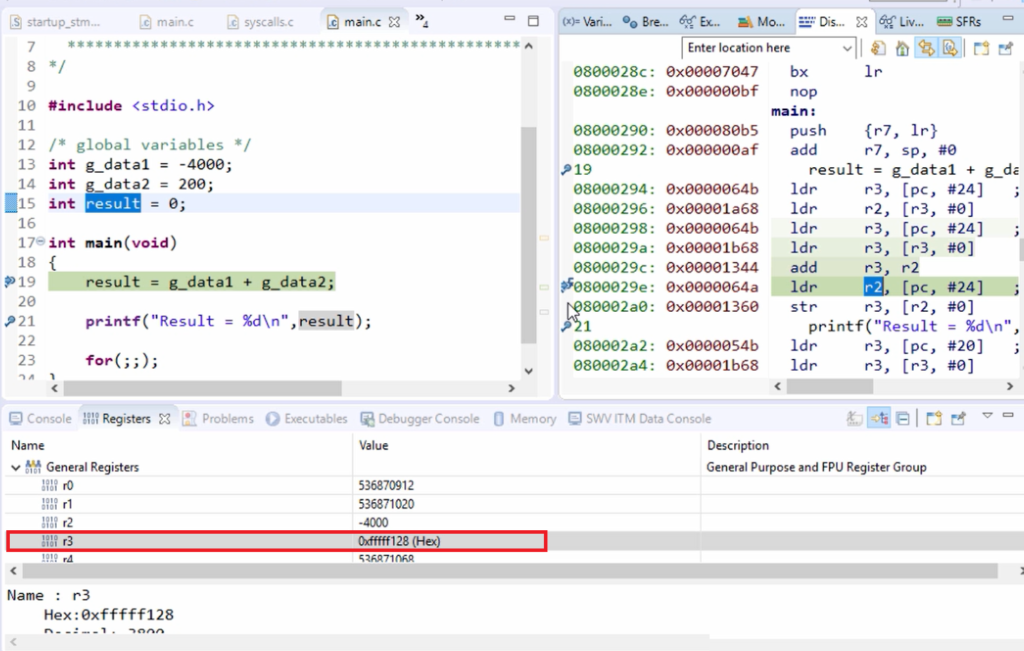
Let me put the breakpoint in the following line, and let’s run. And here, you can see that r2 is loaded with this address. 0x20000088 is the address of the variable result. And after that store is executed. That means the value is placed into this memory location.
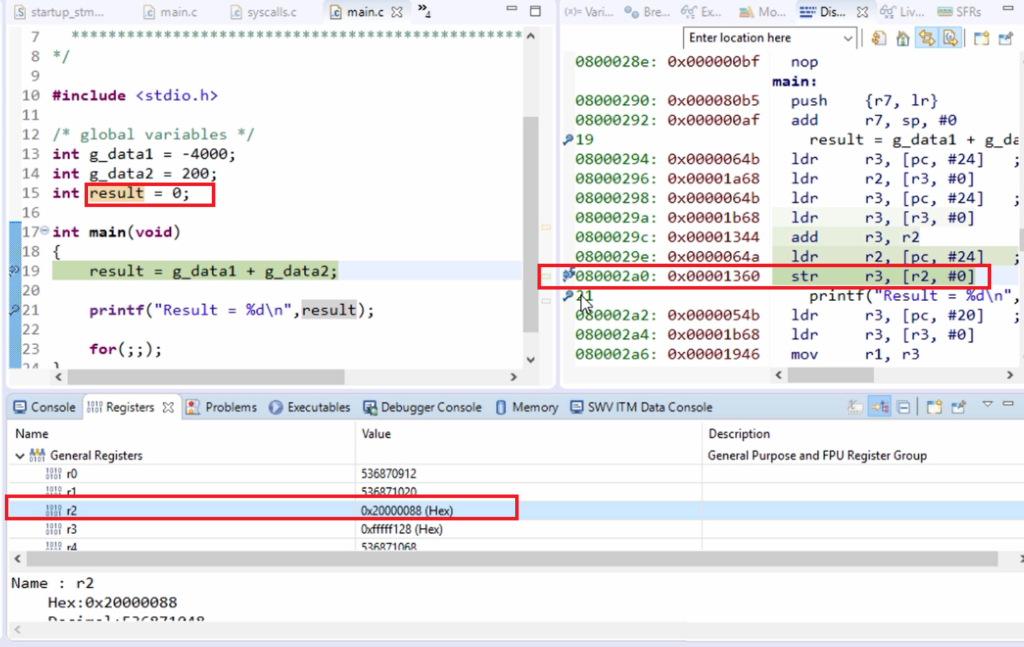
You can see that in the memory location window. Let’s go to the memory browser, so this contains 0. Let’s execute. And here, you can see that the result is placed here (as shown in Figure 17), which is nothing but a -3800.
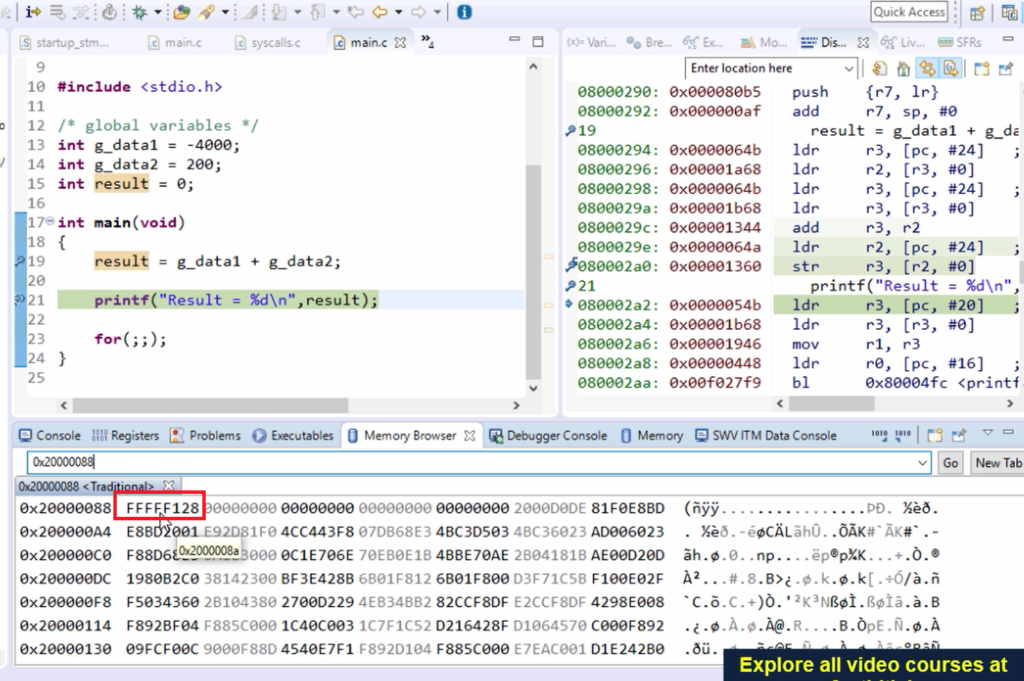
That’s how you can do Instruction level debugging using disassembly.
FastBit Embedded Brain Academy Courses
Click here: https://fastbitlab.com/course1

