Analyzing ELF file using GNU tools
We downloaded the executable into the program memory(FLASH)of the microcontroller. So, the data of our program must be in FLASH memory. How come data arrived in data memory(SRAM)? That’s a very important question, and this bothers most beginners. We have to investigate this.
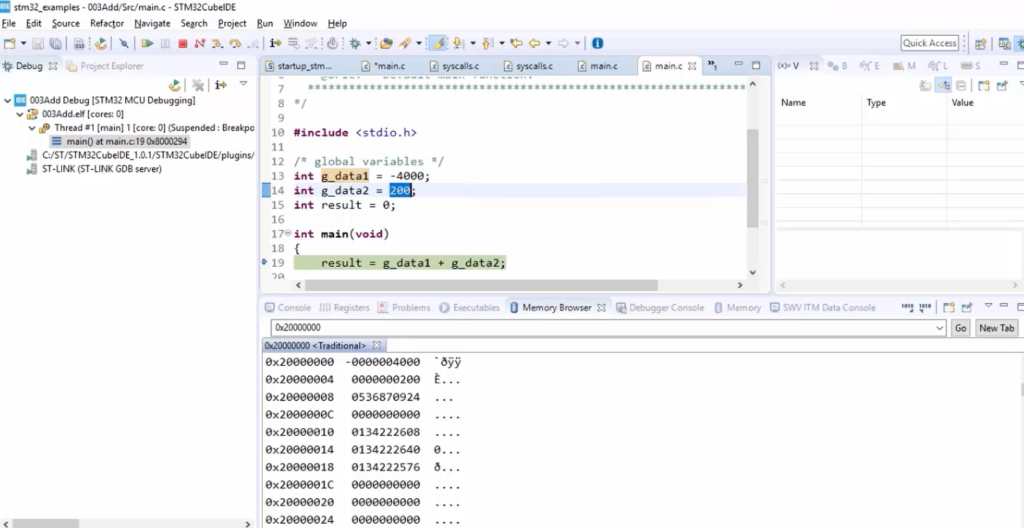
So, as I said before when we created the .elf file, -4000, 200, these data are also part of that executable file. And after that, we download that into the program memory, which happens to be FLASH memory. That means data is indeed stored in the FLASH memory. So, we can see that. Now let’s check where exactly these data are stored in the flash memory.
Now to see that, we need its address. For that, let’s analyze the .elf file using some of the gnu tools.
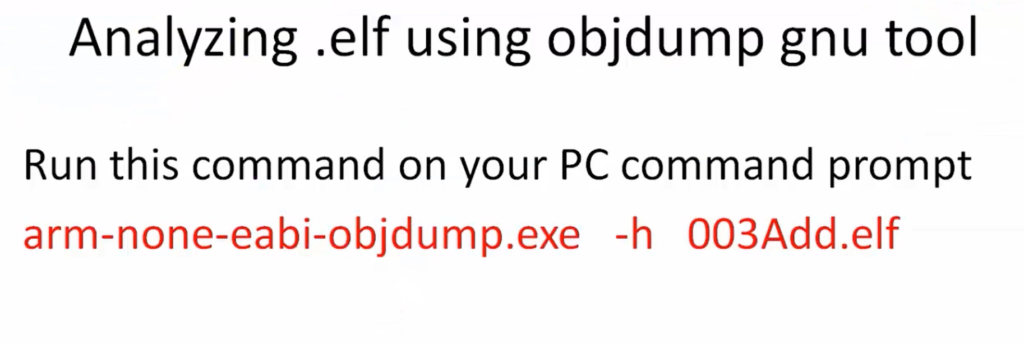
The gnu tool which we are going to use is object dump. Now run this command on your PC command prompt( as shown in Figure 2), and you will see some information. Let’s analyze that.
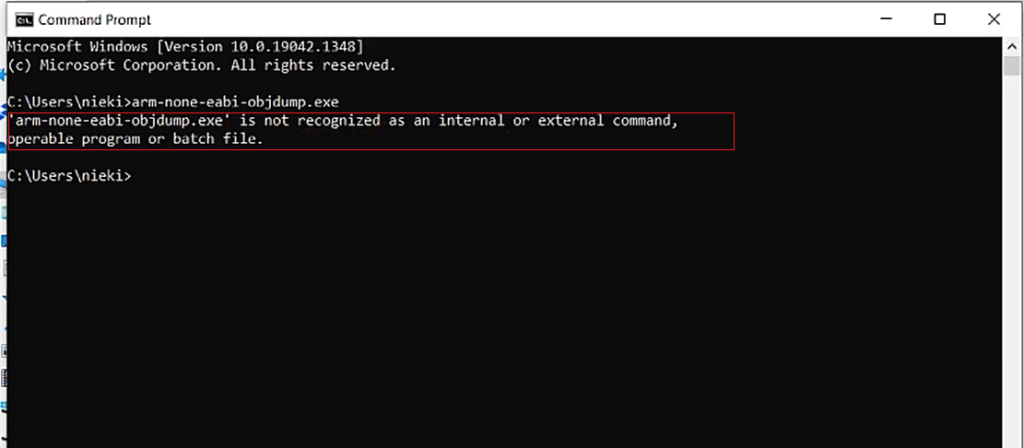
So, while executing this command arm-none-eabi-objdump.exe, if you see this error, ‘command not recognized,’ then don’t worry. You can follow this method.
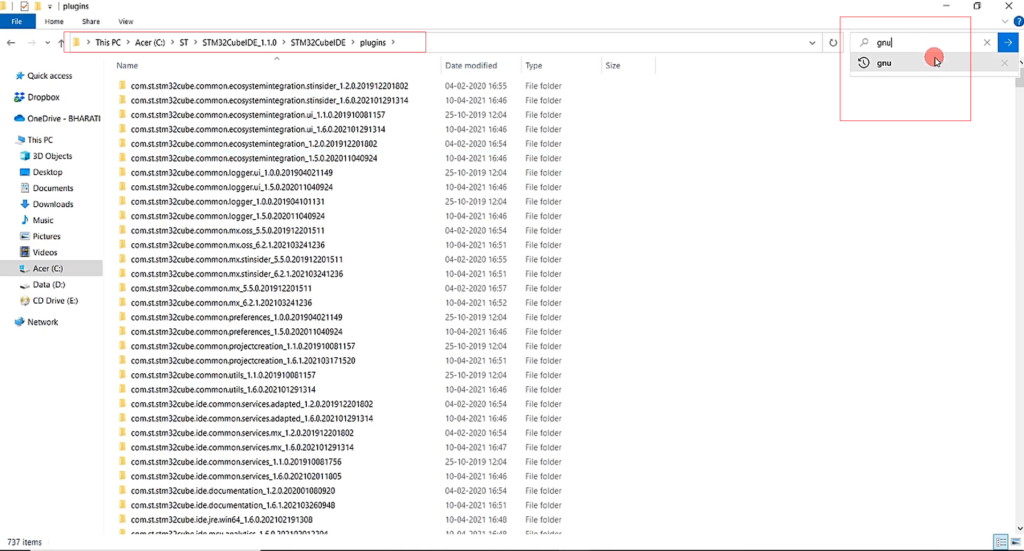
Go to your STM32CubeIDE installation folder in the C drive → ST, go to STM32CubeIDE, and go inside plugins. And here, search for gnu, as shown in Figure 4.
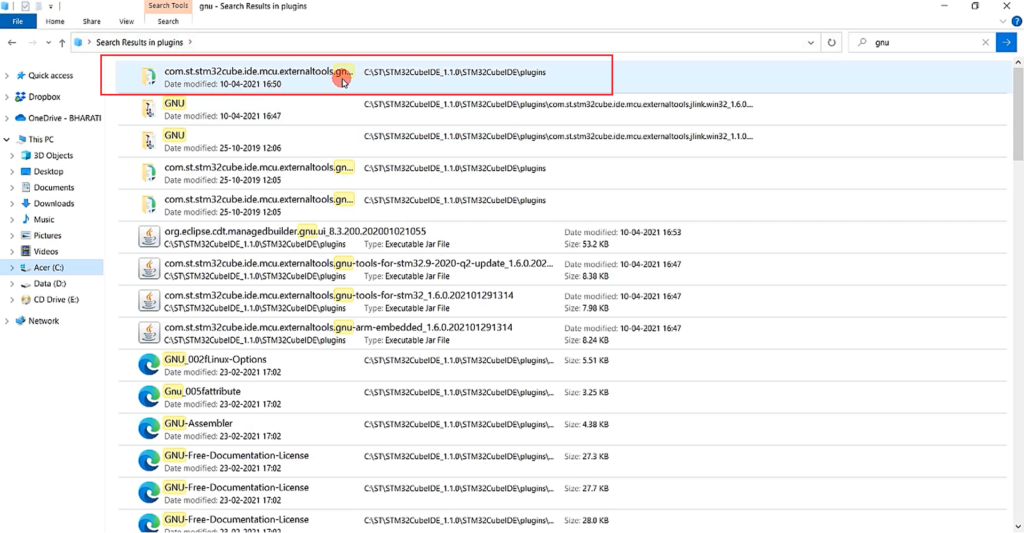
You see com.st.stm32cube.ide.mcu.externaltools.gnu something like this, as shown in Figure 5. Click on that.
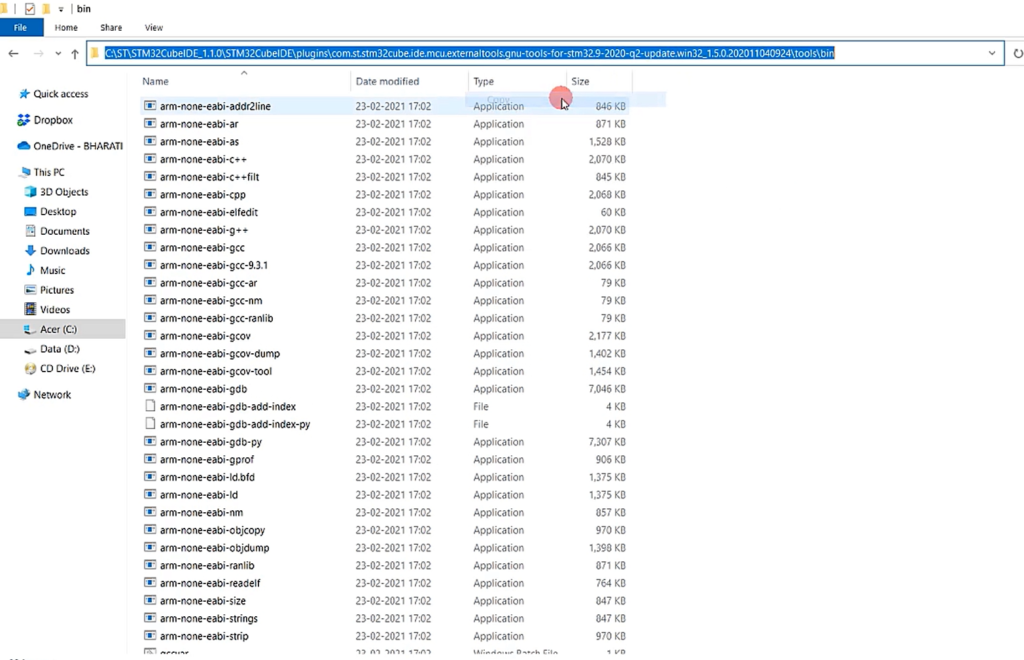
Its name is something like this Gnu tools for STM32. Here go inside tools and go to the bin.
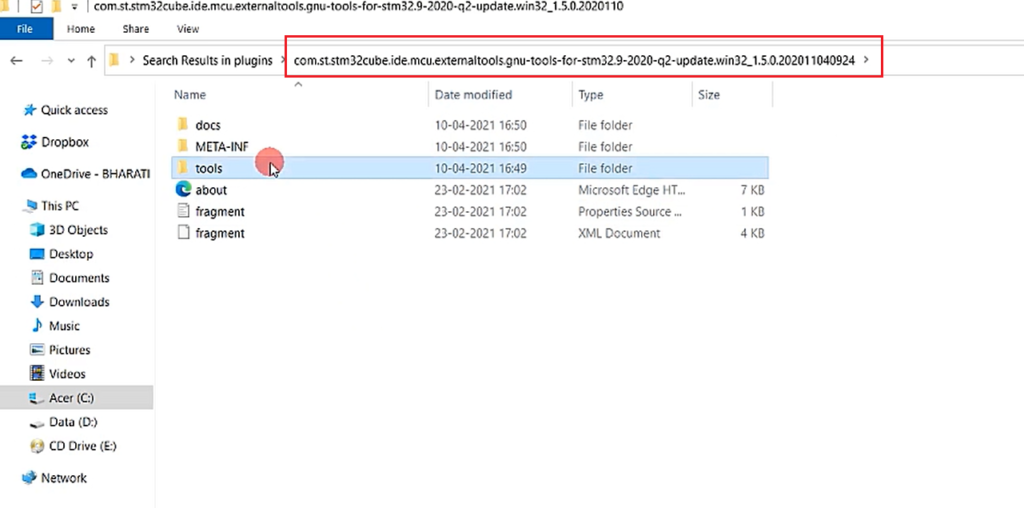
In the bin folder, you see all the cross-compilation tools. You copy this path, as shown in Figure 7.
And then, in your search box, search for Environment variables.
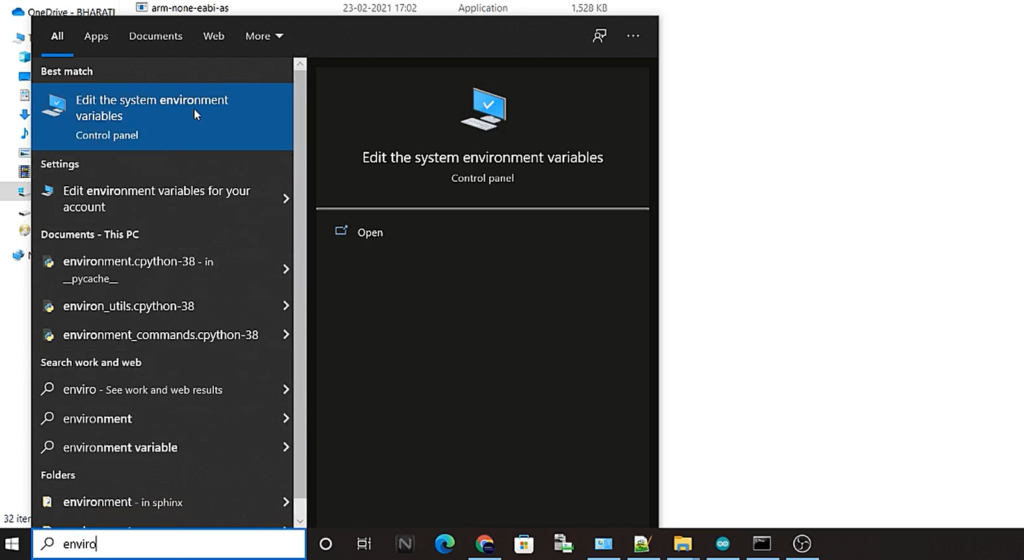
It shows Edit the system environment variables, as shown in Figure 8. Click on that.
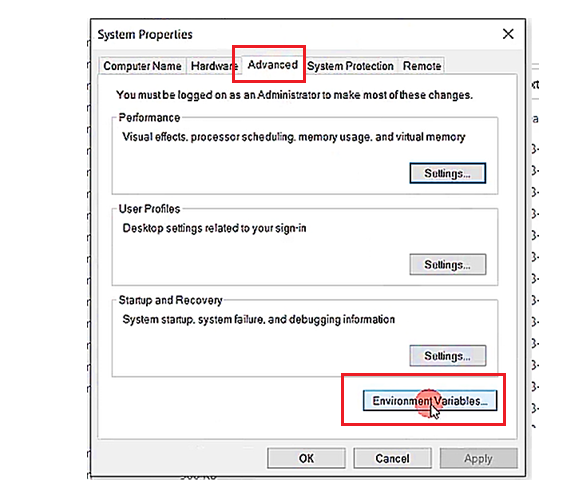
Here go to Advanced, and click on Environment Variables.
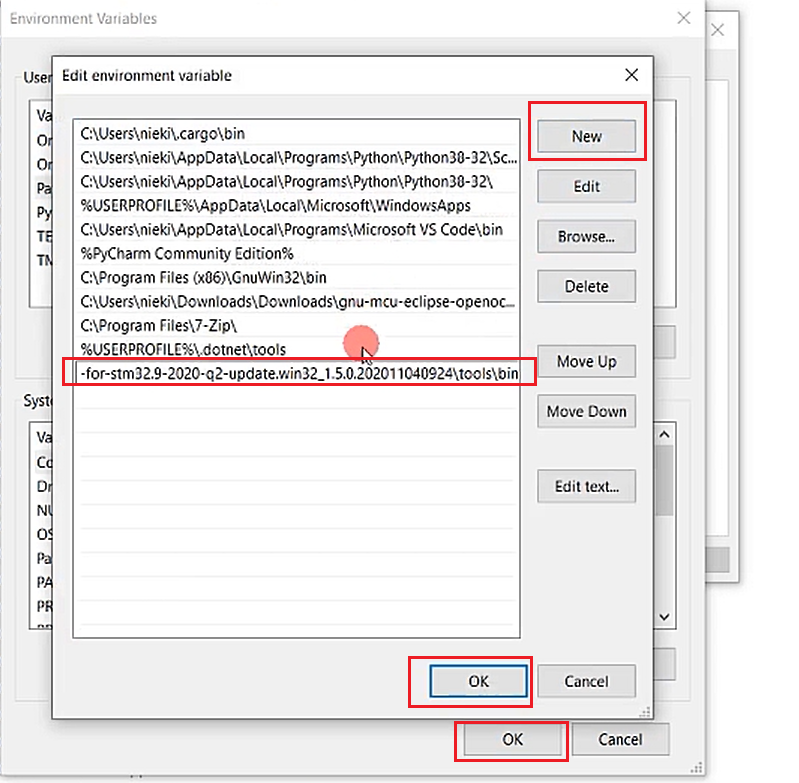
Then select Path and click on Edit.
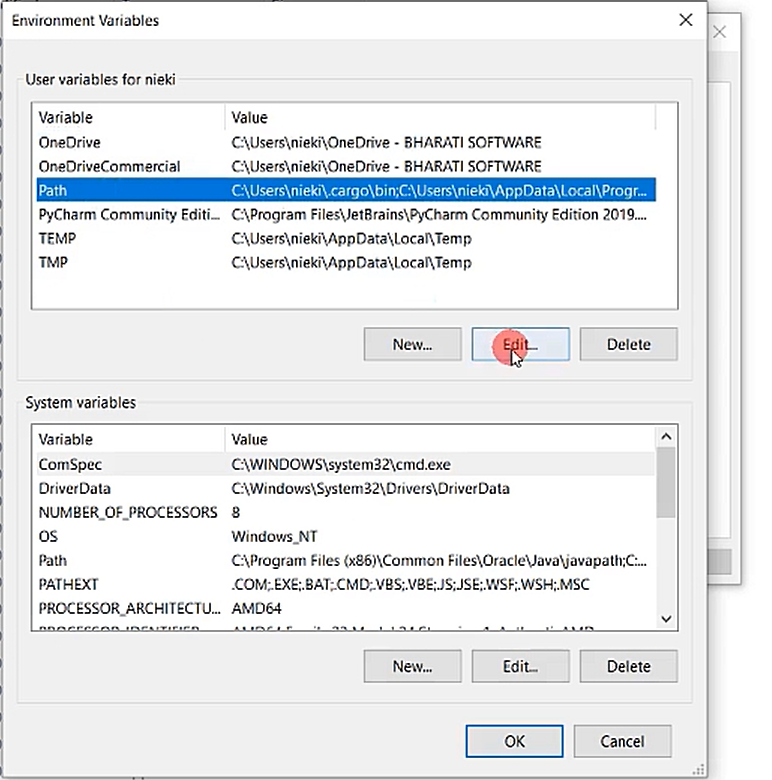
Select New, and paste that link up to the bin. Then Click OK, OK, OK.
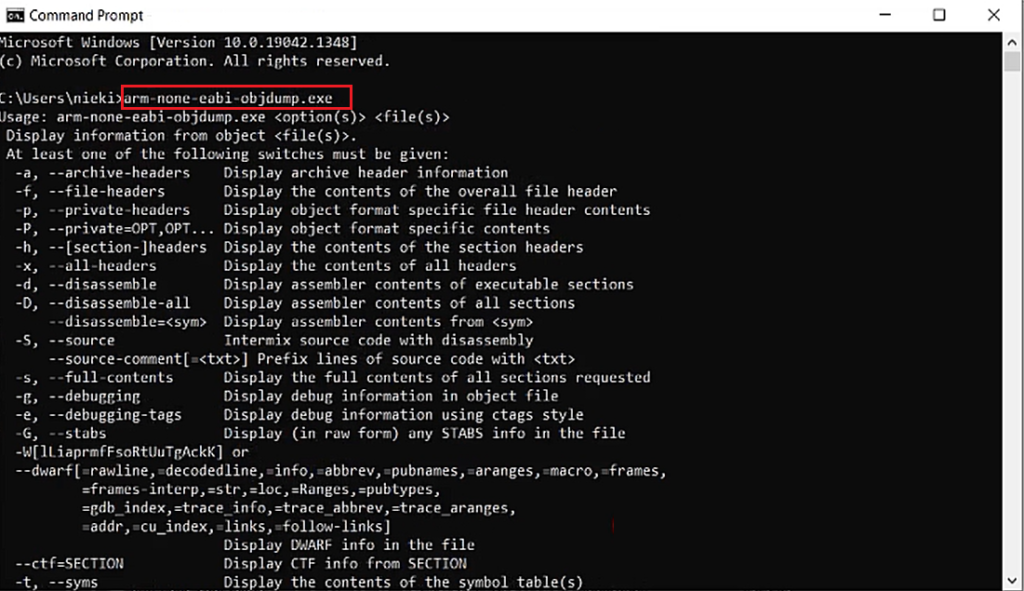
Now let’s try—type arm-none-eabi-objdump.exe. Now you see(Figure 12) that the command is recognized.
Now open the MINGW Command prompt and go to the project folder. So here, let’s get into debug, as shown in Figure 13.
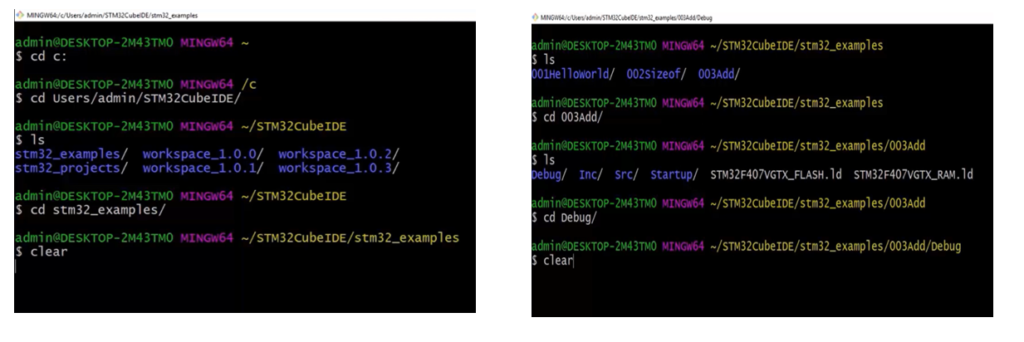
And here there is 003Add.elf.
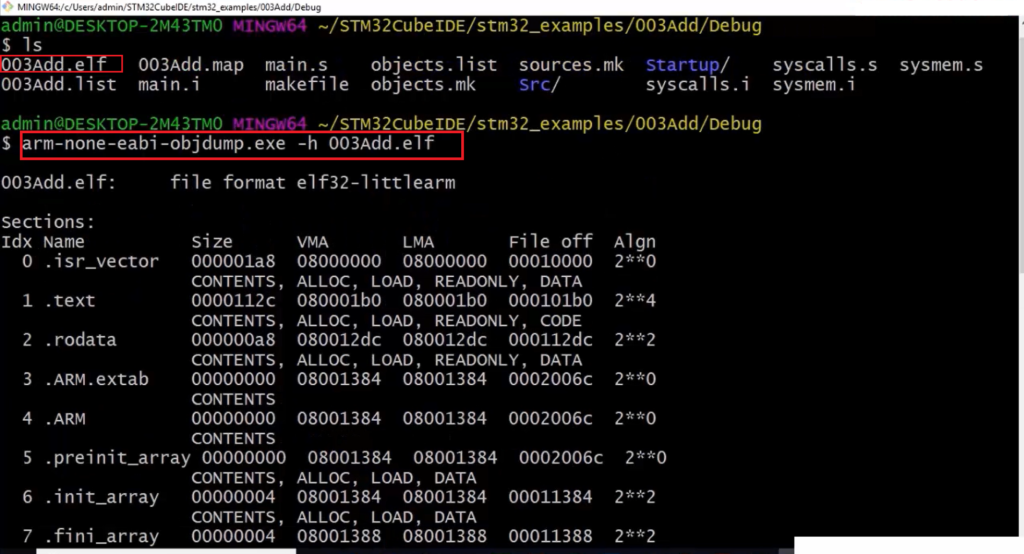
Let’s analyze that using arm-none-eabi-objdump.exe -h 003Add.elf. So, now it produces these results, as shown in Figure 14.
If you can’t run this executable, then don’t worry. You go to your project folder, and there is already a file .list. Just open that.
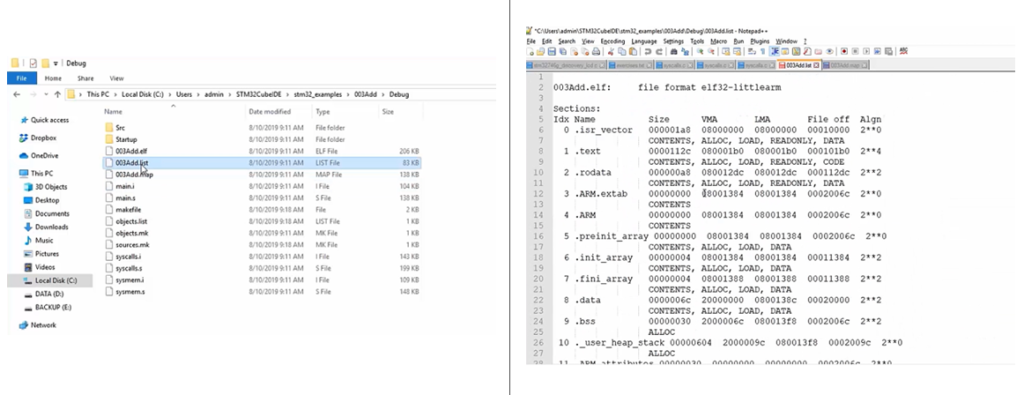
That also will give you the same output. So, if you can’t be able to run that command, just examine a .list file.
First of all, when I run this command with -h, what happened was, let’s see. -h displays the contents of the section headers (see Figure 12). So, the elf format has a section. It has a section header. And if you provide -h, it will display the contents of the section headers.
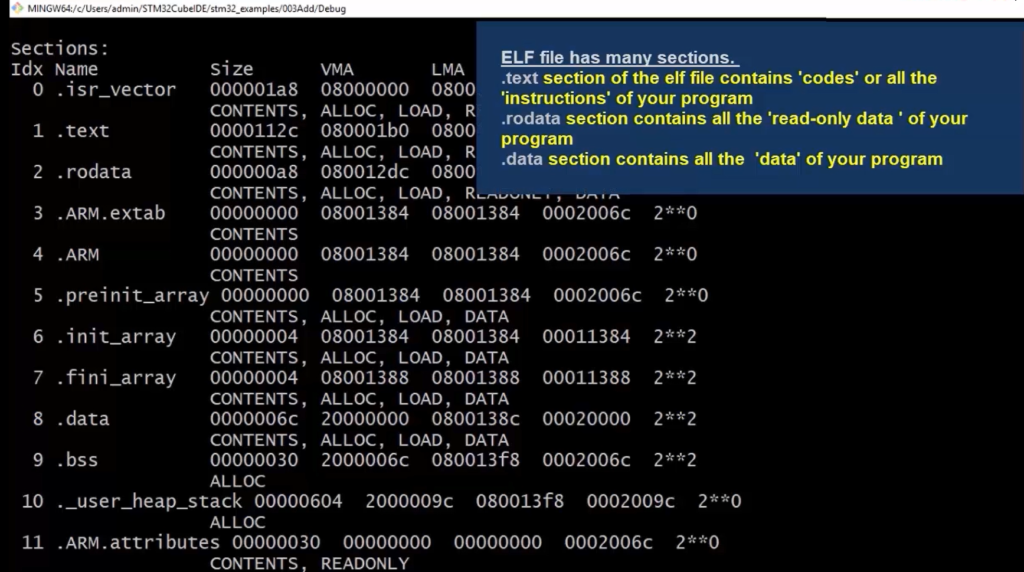
Our elf file has all these sections(Figure 16). And there is a section called .text, where under this section, all the codes are stored. The executable codes, or Opcodes or Machine codes, are stored under the .text section. And all the constant data are stored under the section .rodata.
Actually, it needs some time to understand these sections. But for the time being, just take a look into the .data section. So, .elf has a section called .data. This section contains the data of your program at address 0800138C. This address is nothing but LMA(Load memory address). The data is loaded into this address. It starts from 0; 0x08. So, that is nothing but it falls into the FLASH memory area. Our FLASH memory actually starts from 0x0800. That means the data section is loaded into the flash memory at the address 0800138C.
After that, take a look at the virtual memory address(VMA). The word ‘Virtual’ is used because this is Linux terminology, so don’t give much importance to the virtual. There is nothing virtual here. So, everything is physically implemented.
So, basically, LMA says “where the section is currently loaded,” and VMA says “where the section should finally be copied to.”
If you look into this 20000000 virtual memory address, it says a RAM address. That means it’s the destination. Someone has to move the data which is stored in the flash memory to the RAM memory. So, someone did that. Who did that? So, whether it is done by the hardware or software. The answer for that is, it is done by the software.
So, the data which is there in this 0800138C memory location in the FLASH is copied into the destination location in the RAM, at the address 20000000. And that is done by our code, but we have not written any such code in the program. Our program is very simple. It is just adding two numbers.
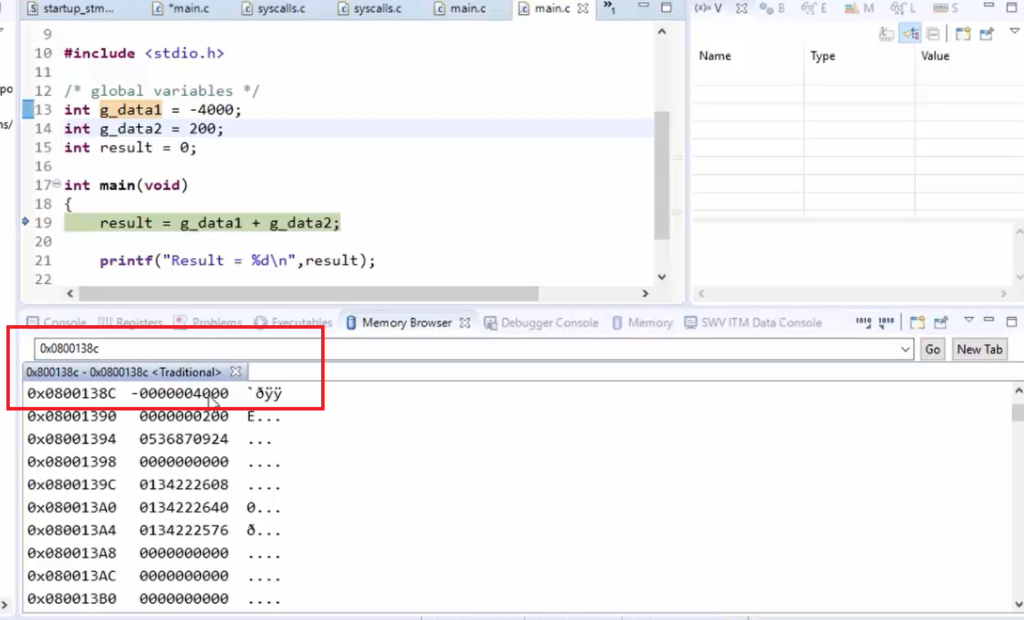
But before that, let’s copy this address 0800138C, and let’s see in the memory browser whether it really has our data or not. Paste that address, and let’s hit enter. Here it is, as shown in Figure 17. Indeed these data are present in the FLASH memory. From here(0800138C), someone is copying into the data memory, and that copying of the data section is taken care of by the startup code of your project.
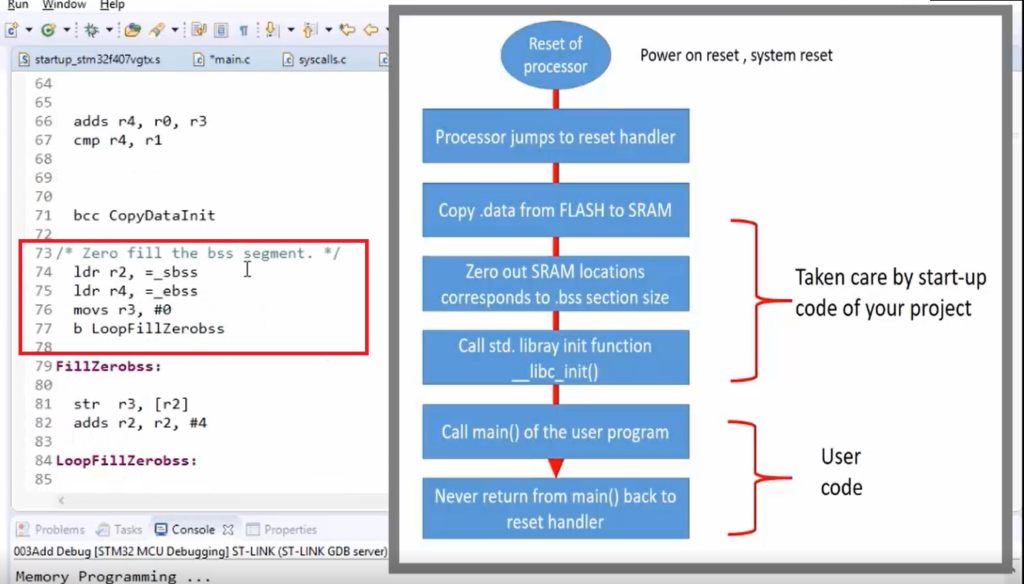
Now the code is in the startup file. In the startup file, there is a routine or a function called ‘Reset_Handler.’ All these routines are implemented in the assembly-level language. The ST gives this startup file.
So, whenever the processor, in this case, the arm processor undergoes reset, the first function or routine, called ‘Reset_Handler,’ is implemented in the startup code. Now, this handler will get called automatically by the hardware.
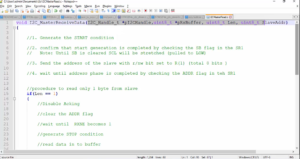
ldr r0, =_estack → This is the very first instruction, which is there the Reset_handlers. That means this is the first instruction that will get executed after resetting the processor.
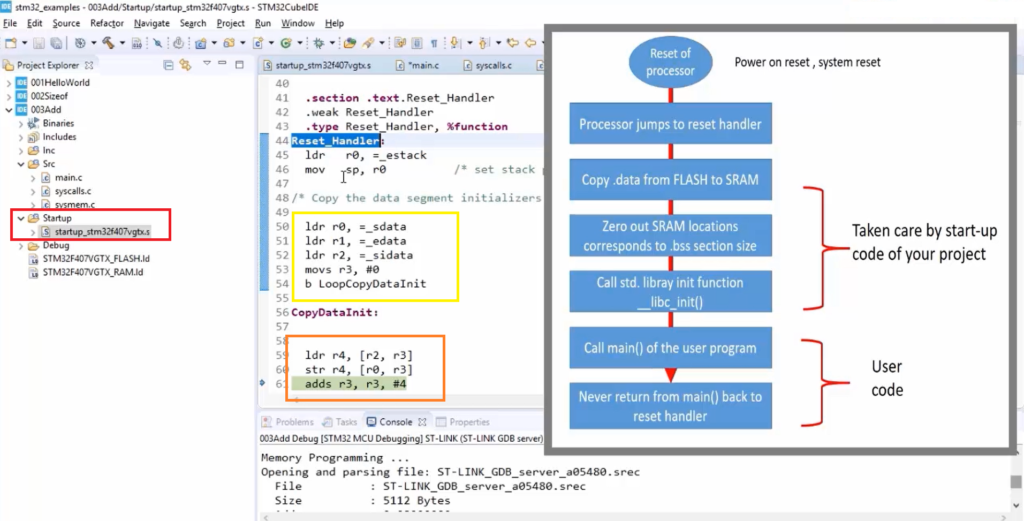
And here, look at the Yellow color line; this is a place where data is copied from FLASH to SRAM. Here actually, these are the initialization of source and destination addresses.
After that(see the orange line), here is a place where data is copied from FLASH to the destination locations that happen to be the SRAM locations.
After that, there is a ‘bss’ section initialization(Figure 19), that is, zeroing of the bss section.
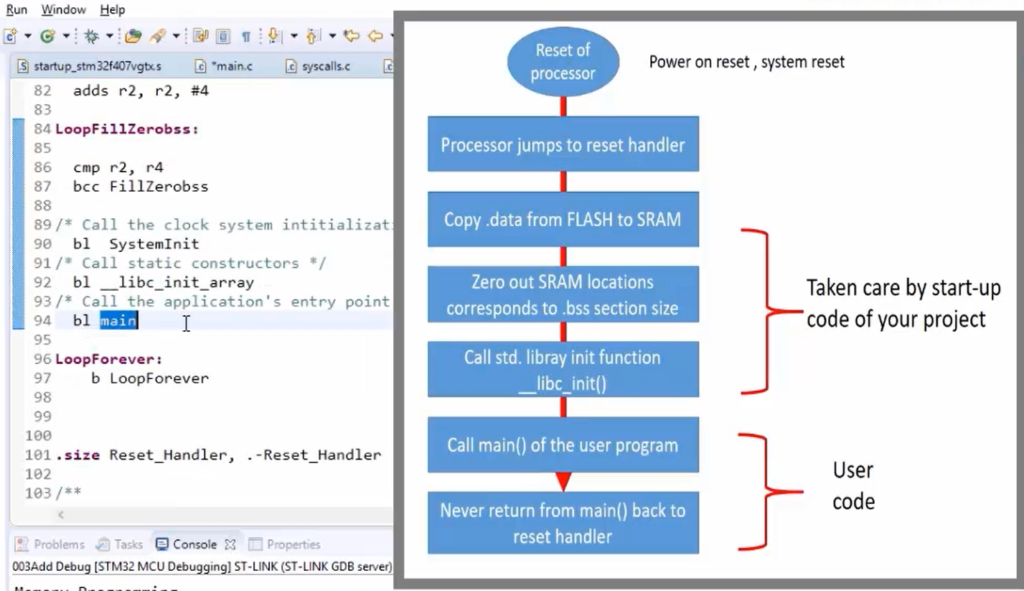
After that, you can see that(in Figure 20) this Reset_Handler calls main, which is implemented in your main.c. So, branch to main. Before that, it also calls the standard library initialization function, that is libc_init. Because we are using the standard library or reduced C library in this project, that’s why, before using those libraries, the initialization function must be called. So, that is called before main. So, if you are not using any standard libraries, then this branch to a libc_init is not required.
You can keep a breakpoint here to see data copying. First, what you do is, so the IDE is in the debug mode, so remove the breakpoint first. What you do is first reset the chip. Now the execution halted at the main.
Go to the startup file, keep a breakpoint here in the Reset_Handler at this position( as shown in Figure 21), and reset the chip again.
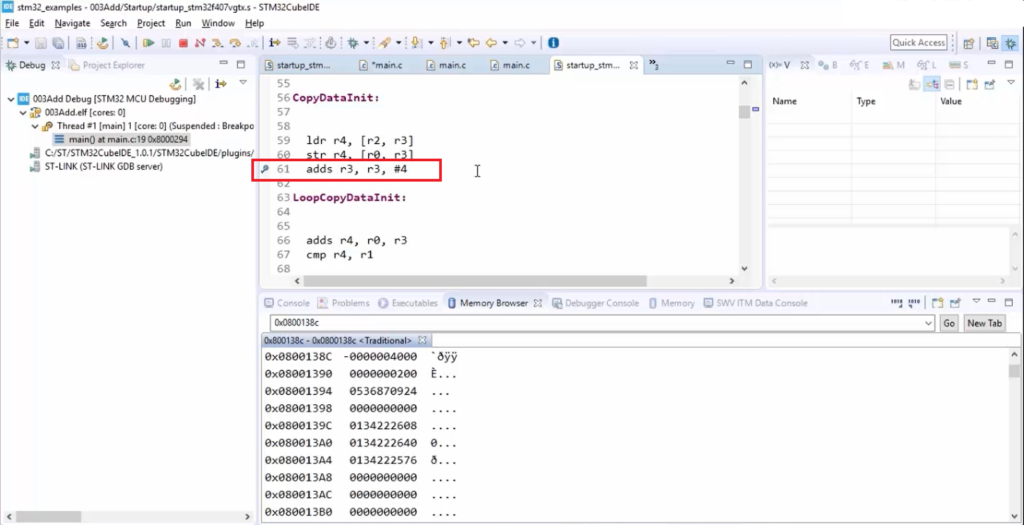
Once you reset the chip, the code execution hangs here( as shown in Figure 22).
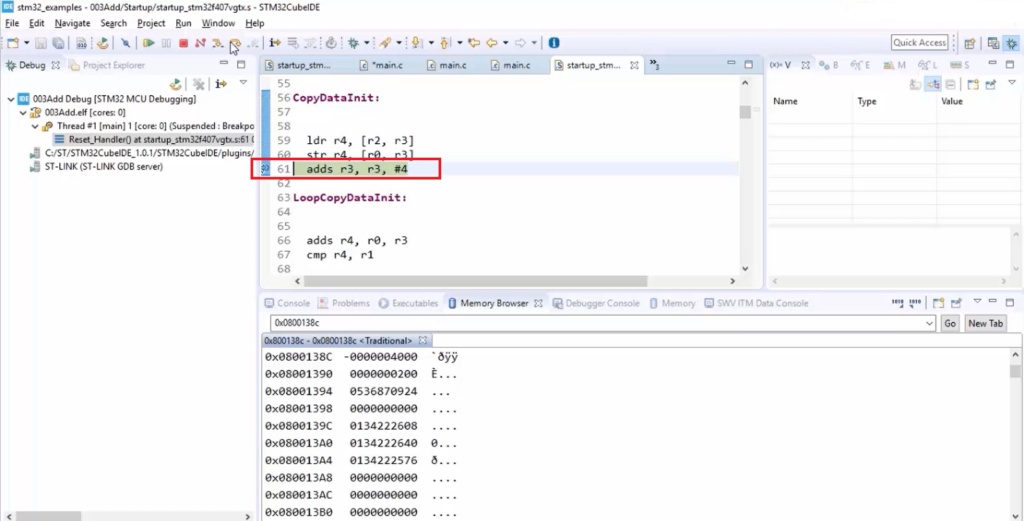
Now, check the contents of r0 and r2 because those registers contain source and destination addresses.
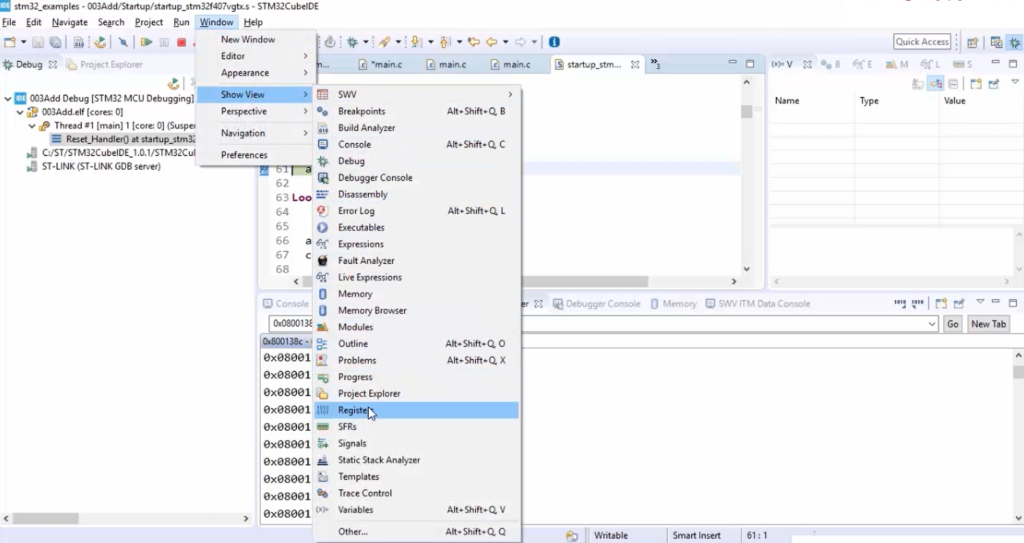
To check the processor registers, you have to go to the Window, Show View, and go to Registers.
Here there is a General Register, so open that. And here, r2. Let’s select r2.(Figure 24)
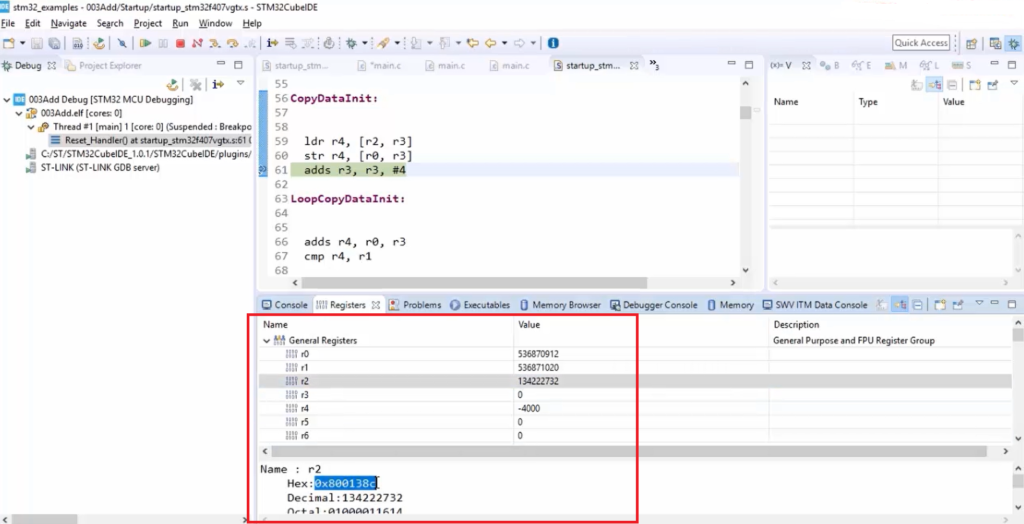
And here (Figure 24), r2 is the source address, which is actually a flash address where data is stored. So, from r2, a value or data is copied into r4. You can see that r4 is -4000. So, that’s our data, and then it is stored to r0. What is r0? r0 is the RAM address. So, like that, data copying takes place, and that code is added by the startup code.
So take away from all these articles is that you should be able to identify data and code sections of your program and the code actually, ‘code’ that means, opcodes, machine codes, they actually will get stored in the flash memory, that is our program memory. And your program’s data is copied from FLASH to data memory, that is, SRAM from the startup code. So, that startup code is part of your project and is added automatically by the IDE when you create the project.
FastBit Embedded Brain Academy Courses
Click here: https://fastbitlab.com/course1