Exercise: Testing via debugger Part-1
Now let’s check whether created tasks are really executing on the microcontroller or not.
- First, Compile the project (Figure 1).
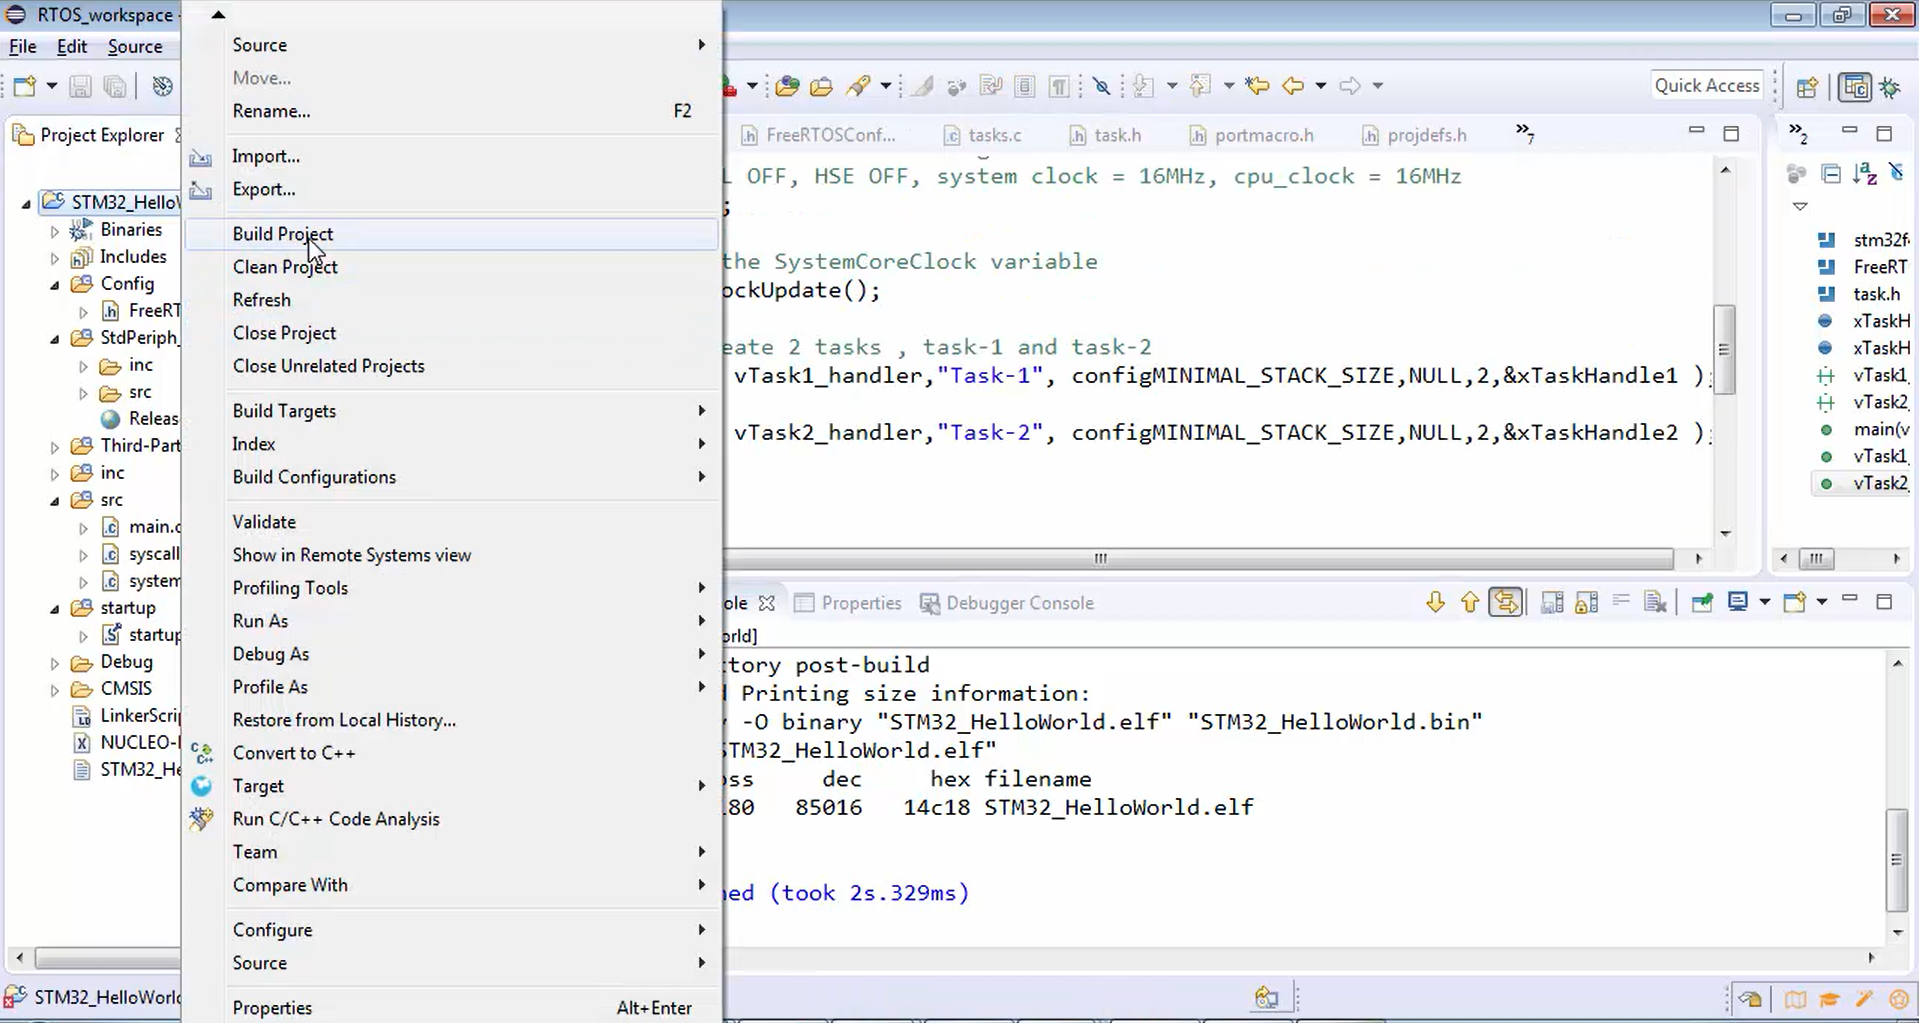
- After successfully compiling the project, let’s just download the code to the board as follows:
i. Go to target and click on program chip (Figure 2).

ii. Then tick the reset after program checkbox and then click ok (Figure 3).

iii. Now the code is being uploaded to the chip (Figure 4).

iv. Now the code is programmed onto the microcontroller.
- Now we cannot visualize this by using some logs because we are not printing any logs from the firmware. In order to check whether the tasks are really working or not, you have to use the debugging method.
- Let’s go to the debug mode. For that, right-click over the project, then click on debug as and select the Ac6 STM32 C/C++ Application option, as shown in Figure 5. While entering into the debug mode, you will find a pop-up window, as shown in Figure 6. Just click yes.


- Now in Figure 7, you can see that the eclipse perspective is changed to debug mode.

- You can see the C/C++ perspective at the top of the window (Figure 8), where you can edit, compile and download the code. On the right side of the C/C++ perspective, there is a debugging perspective (Figure 9) that is changed automatically when you get into the debug mode.


- In Figure 9, you can see that there are lots of breakpoints that have been set, which was due to the earlier debugging sessions. Now let’s just clear all the breakpoints. For that, click over the remove all breakpoints option shown in Figure 10.

- In Figure 11, you can see that the code is not running. It is actually halted at line 28, which is the first instruction on the main program or main function. So, we are in the main function now.

- Let’s keep a couple of breakpoints. Keep a breakpoint in line 34, task handler1 and task handler 2, as shown in Figure 12, Figure 13, and Figure 14, respectively.


- In this application, we are actually creating two tasks, and the task handlers are vTask1_handler and vTask2_handler. Since those tasks are of equal priorities, they should execute alternatively, as shown in Figure 15. So, the first task 1 handler should run for some time, and we don’t know the exact time for which the task 1 handler will run. Let’s say task 1 handler will run for 1 millisecond, and then task 2 handler should run.

Let’s see whether the alternative execution happens or not. Now we are in the main function, just hit the run button (Figure 16).
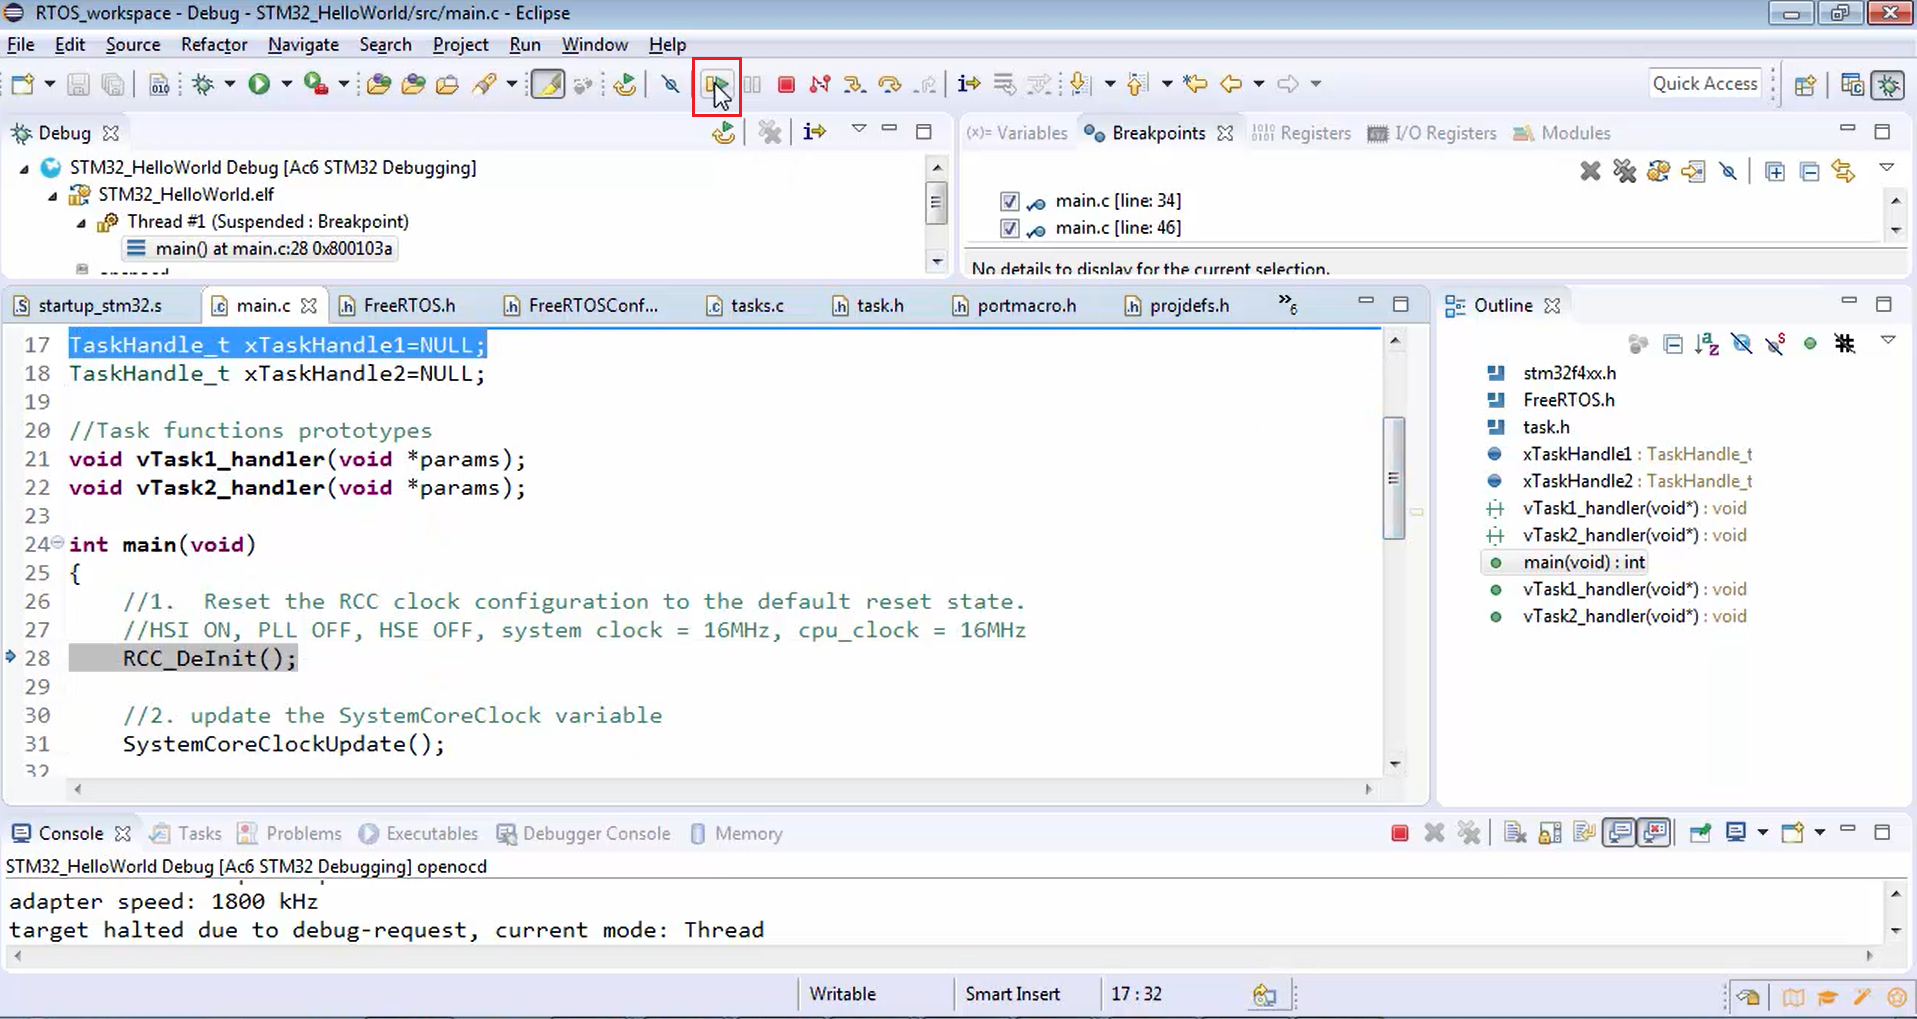
- The first two functions in the main have been executed successfully without any halt. Just remove the breakpoint at line 34 and hit run once again. In Figure 17, you can see that none of the breakpoints has been hit because the task handlers are not actually executing.

- Now let’s see where exactly the code is hanging. So, let’s hit suspend (Figure 18), and now you can see that the program is hanging in the infinite loop, which is there in the main (Figure 19). That means the tasks are created now. That doesn’t mean that they are scheduled to run. Now it’s time to invoke the scheduler in order to schedule those created tasks.


FastBit Embedded Brain Academy Courses
Click here: https://fastbitlab.com/course1

