Analyzing memory consumption and testing LVGL on STM32F429 board
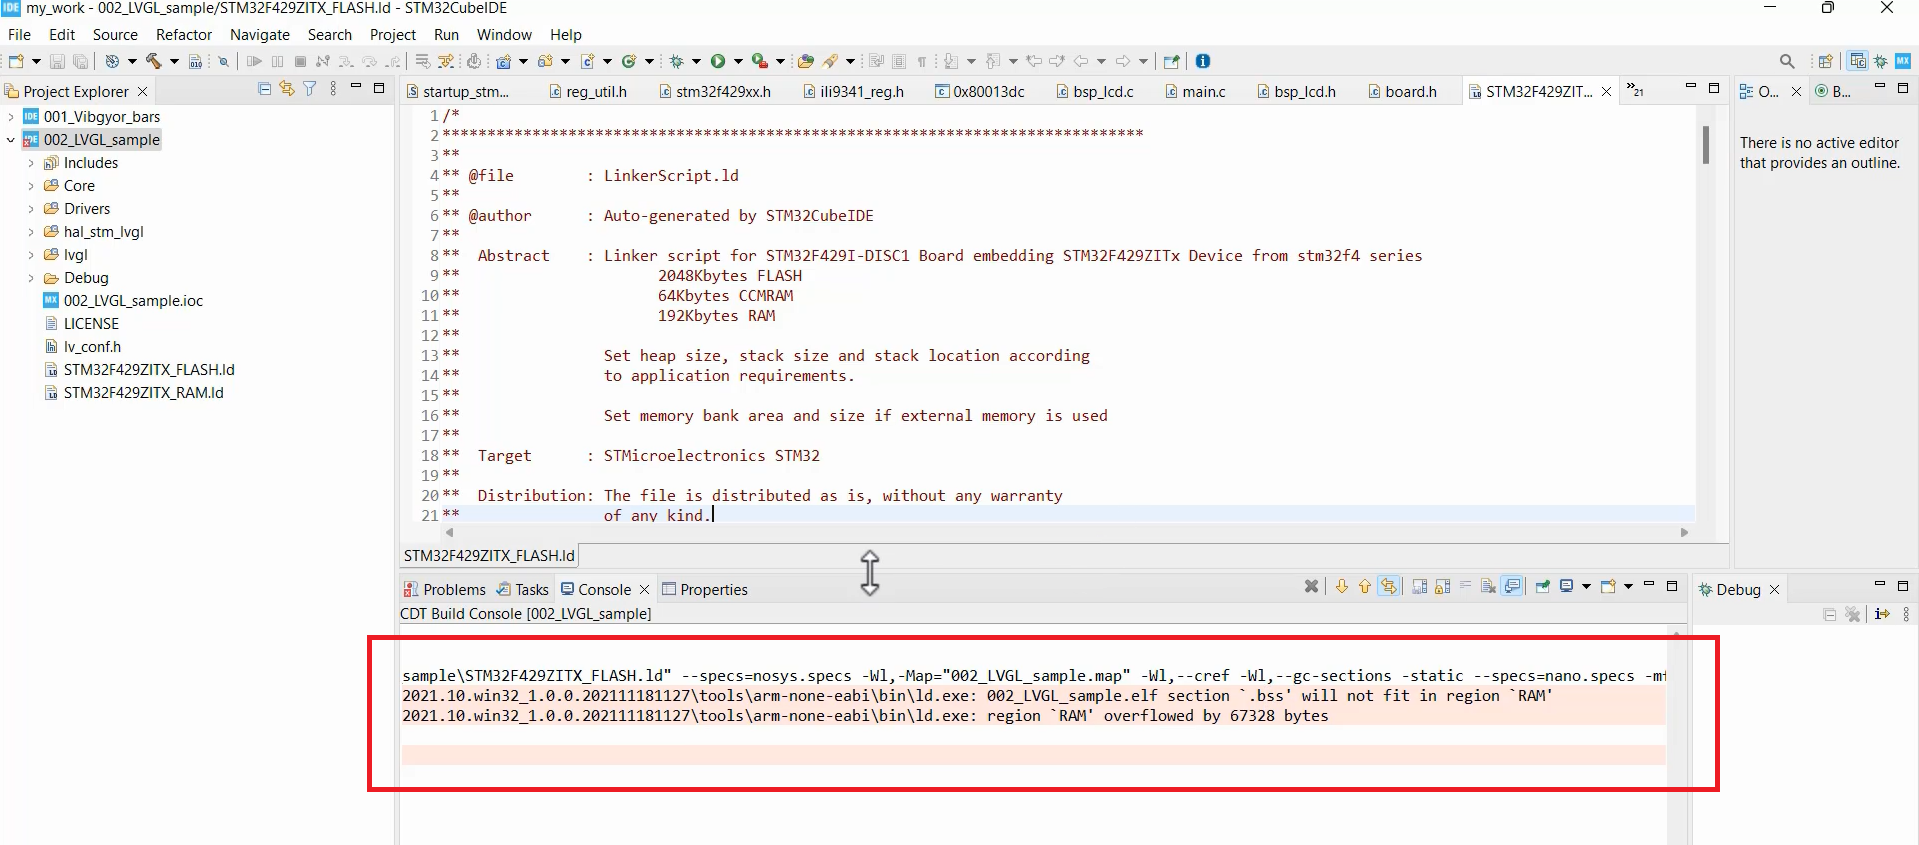
We have encountered a problem with our project. Essentially, the error indicates that our project’s ‘.bss’ section does not fit into the on-chip RAM, and we are not using any external RAM, such as SDRAM.
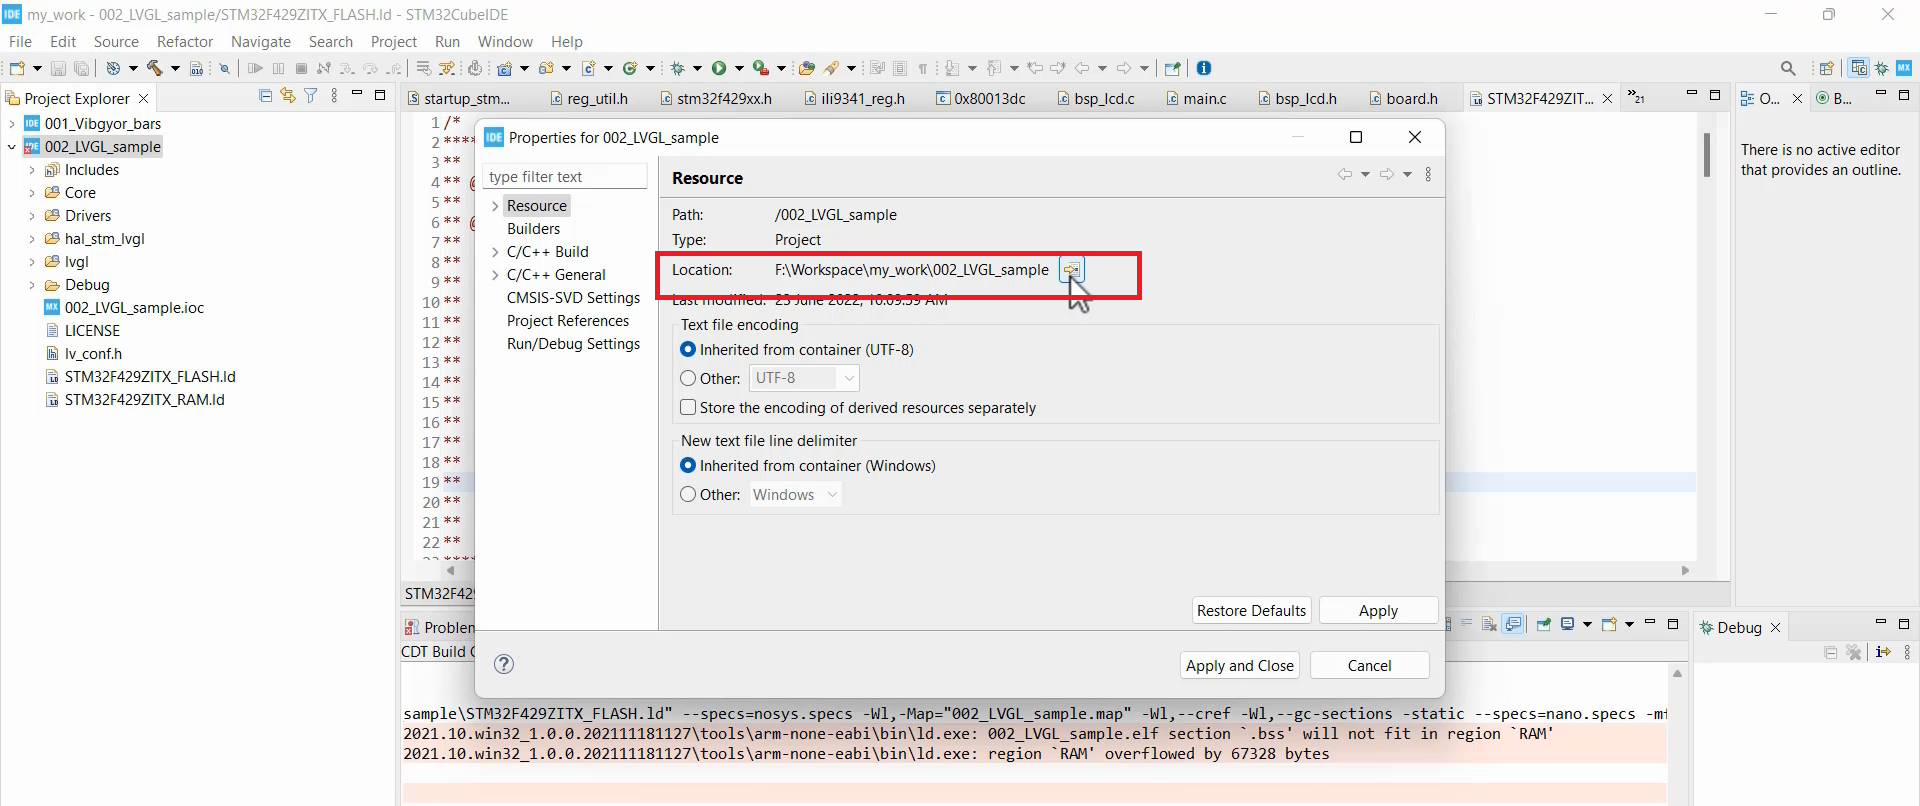
Let’s investigate how our ‘.bss’ is overflowing. To do that, we will examine the memory map file of this project. Follow these steps: Right-click on the project → Go to properties → Navigate to the Resources section → In the location section, browse to the project directory.
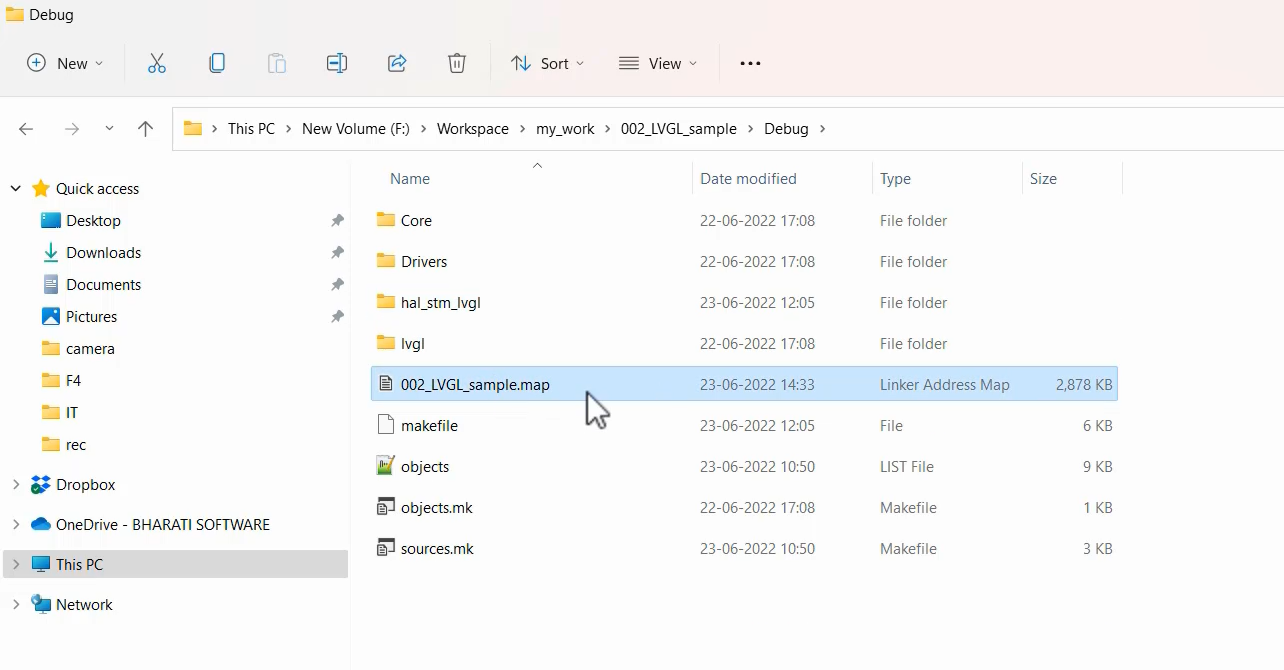
Once in the project directory, go to the Debug section, and there you will find the project’s map file.
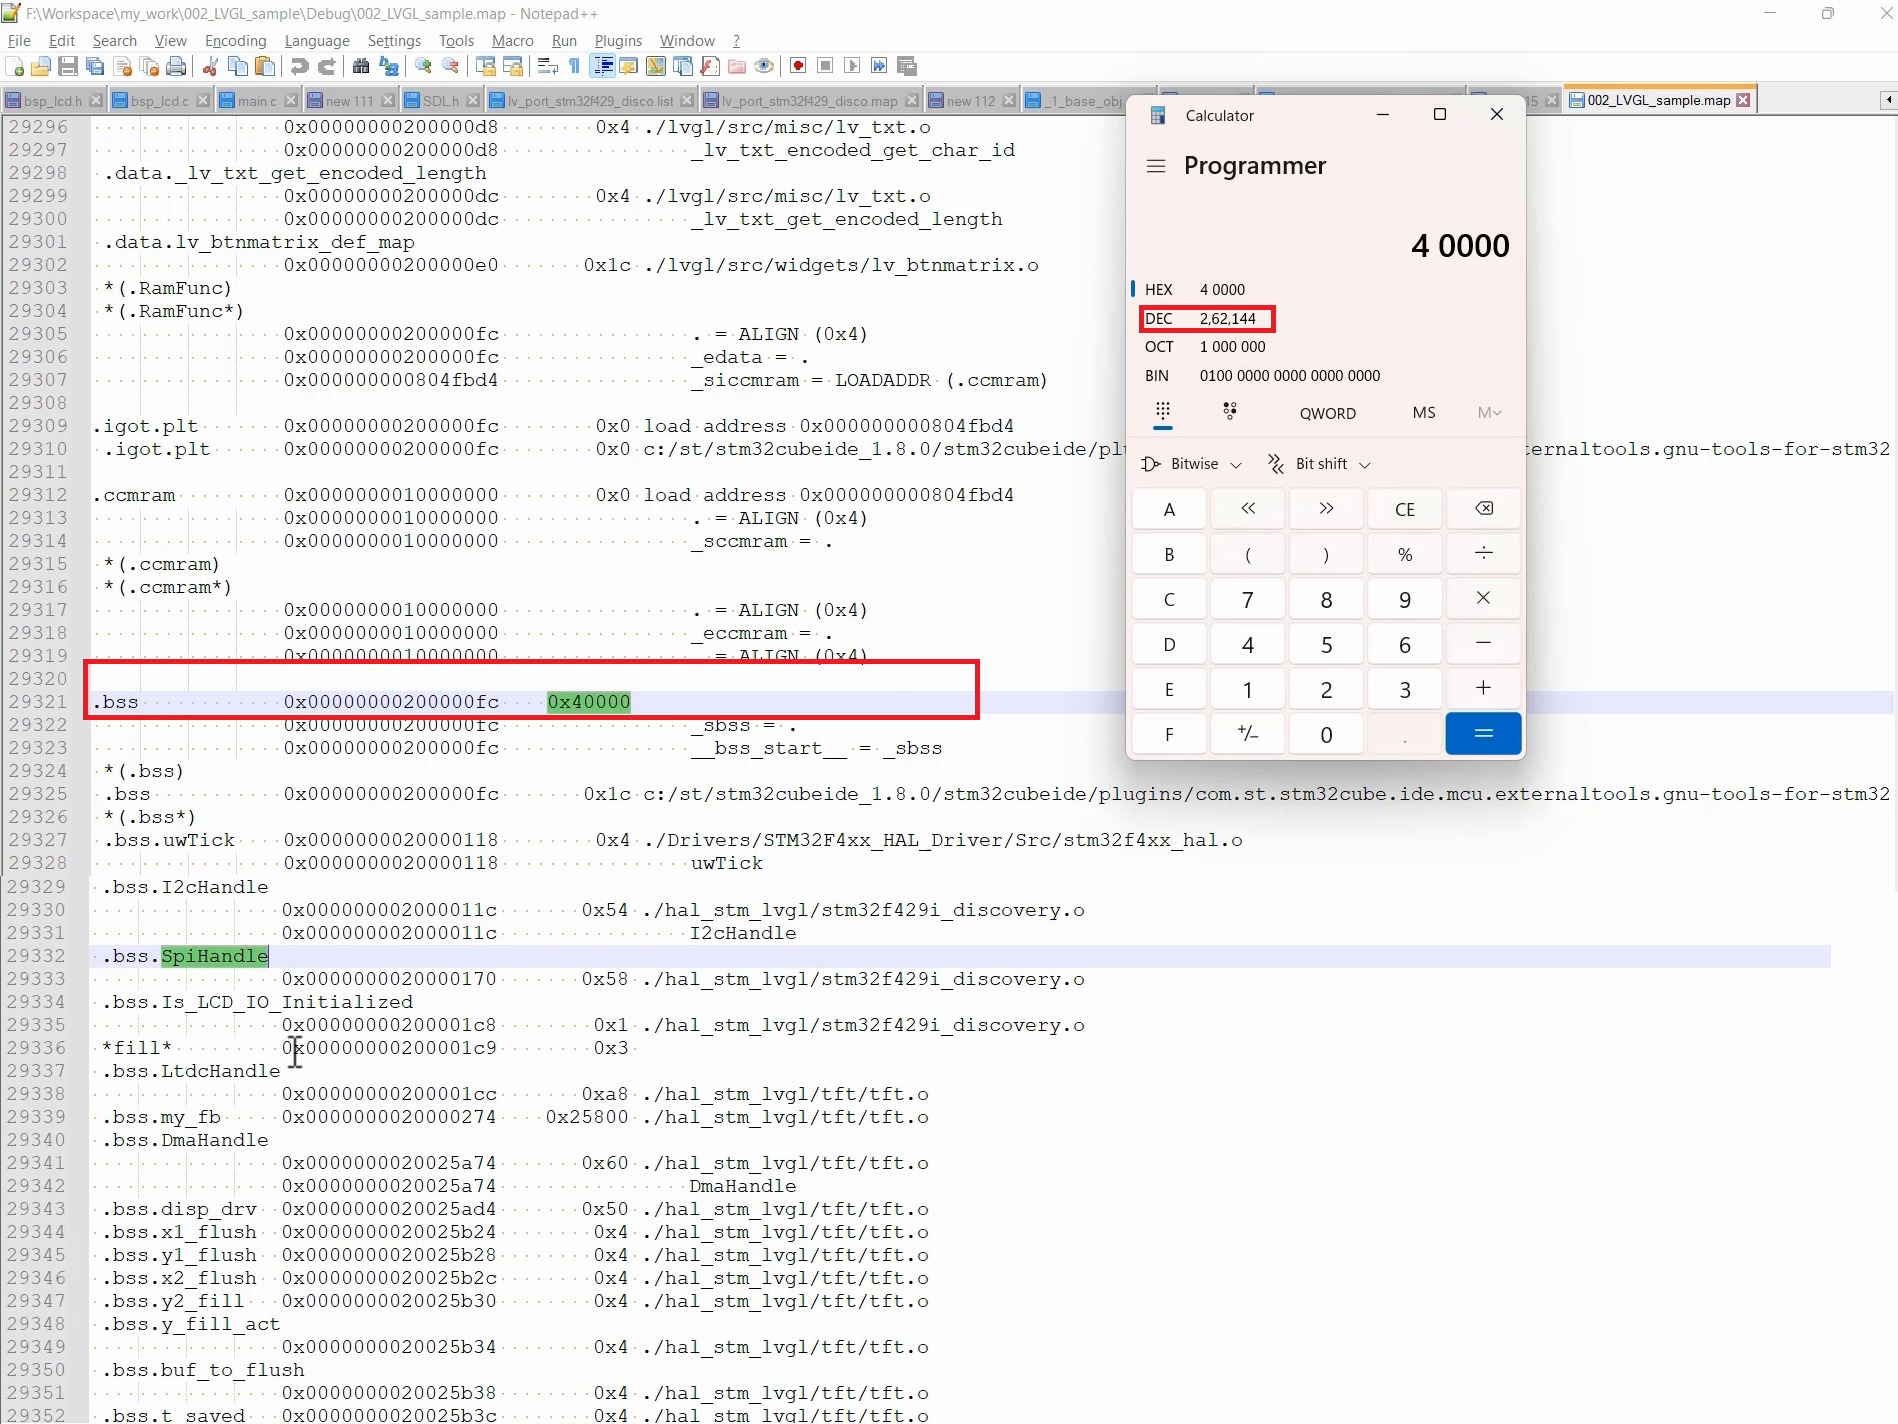
Open that map file and browse through the document until you find the ‘.bss’ section (as depicted in Figure 4).
As you can see here, the beginning of the bss is at address 0x00000000200000fc, and its size is 0x40000. This corresponds to 262,144 bytes.
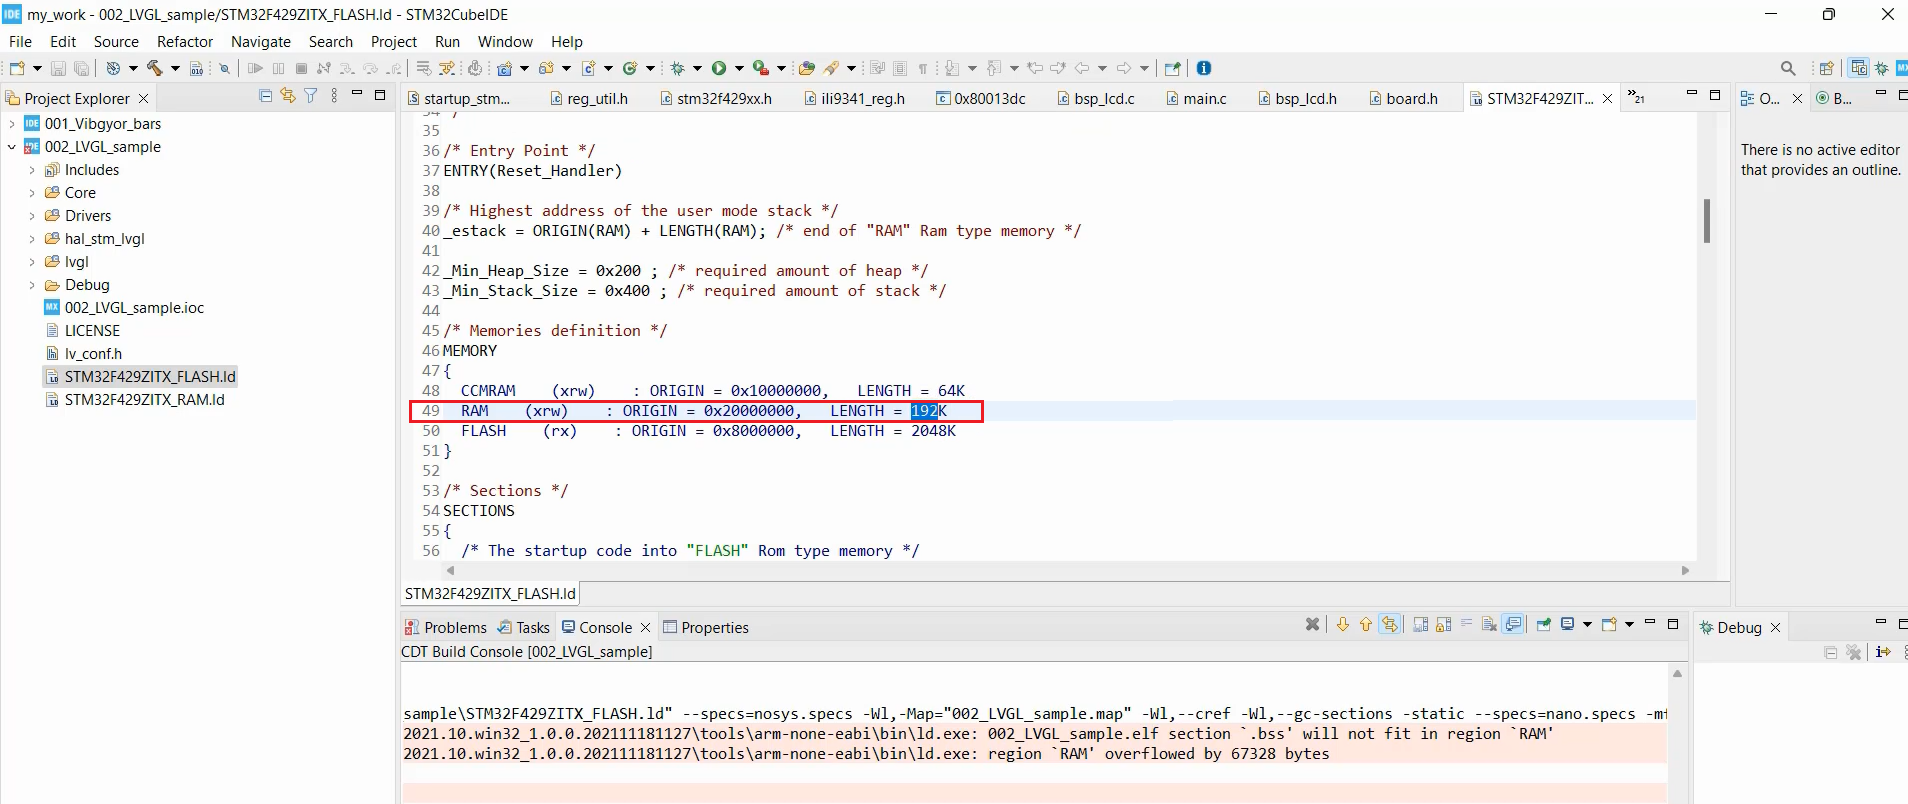
What is the size of our RAM?
To do this, check the linker script in the project, where you’ll find that the RAM size is 192 kilobytes, which is around 262 kilobytes.
You can also see(Figure 4), what are all components that contribute to the growth of the .bss.
For example, we have an I2cHandle, which is a structure. That contributes 0x54 this much bytes to the growth of the .bss.
And the major contribution comes from .bss.my_fb, this frame buffer. As you can see, it adds around 150 kilobytes.
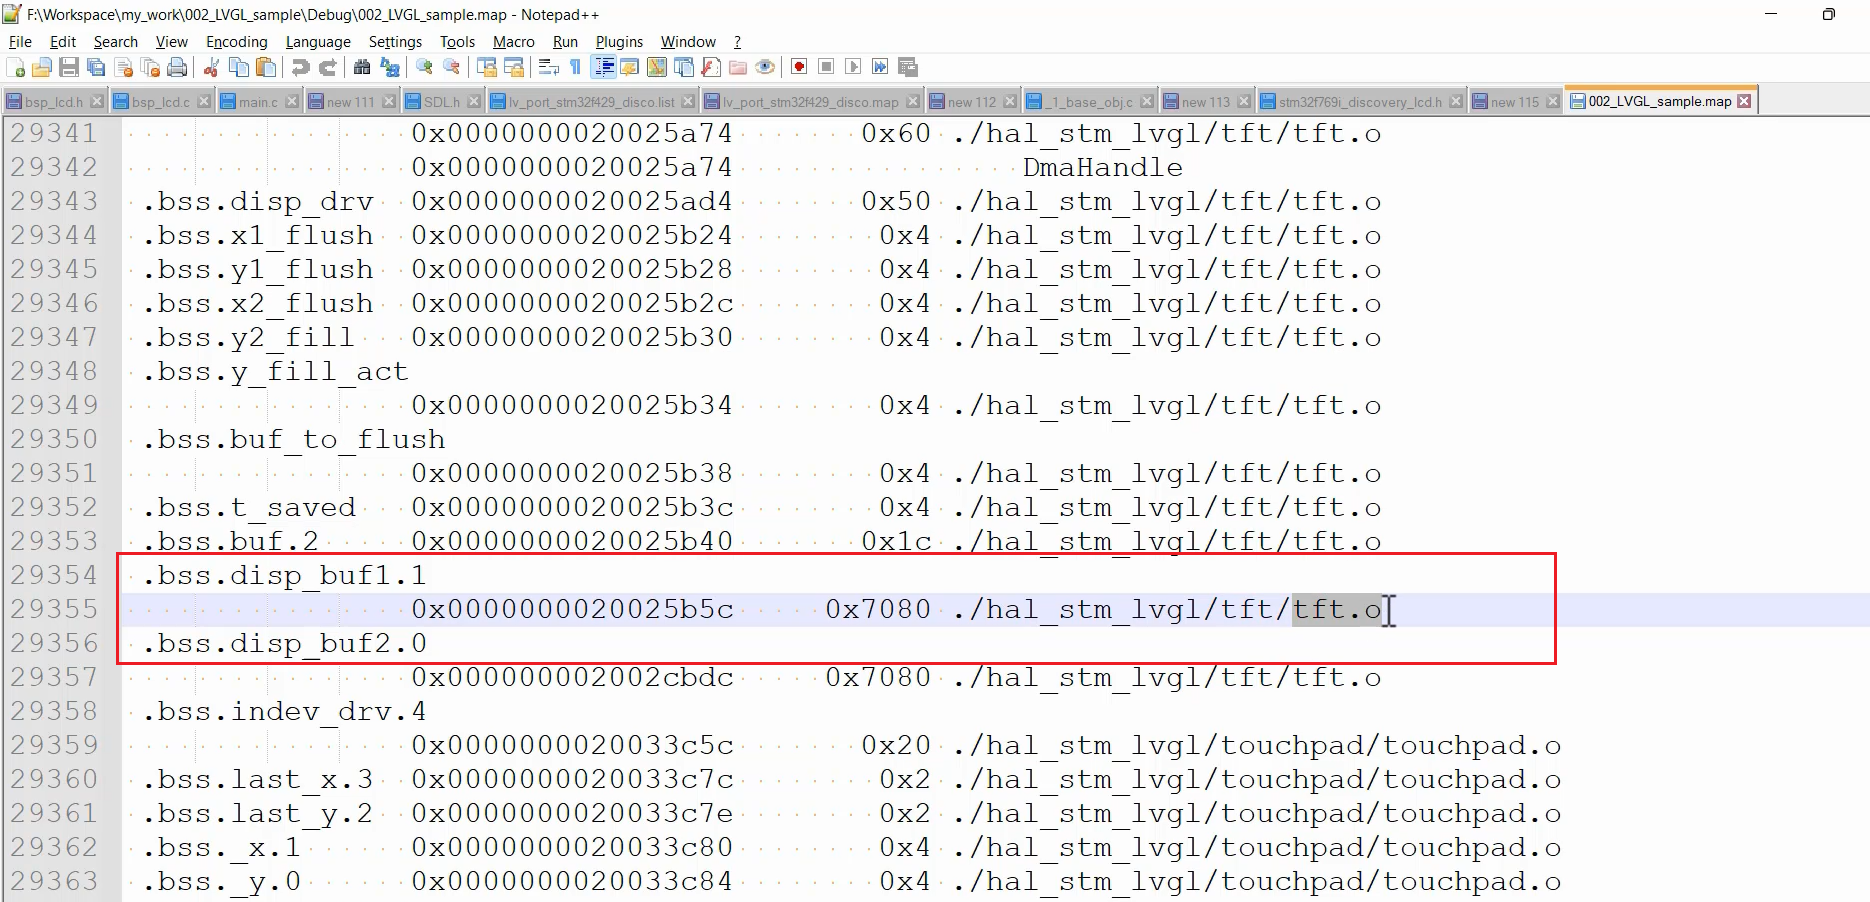
Apart from that, you can also observe that there are 2 display buffers named ‘display_buf1’ and ‘buf2’. These contributions come from the ‘tft.o’ file. Let’s analyze the ‘tft.o’ itself.
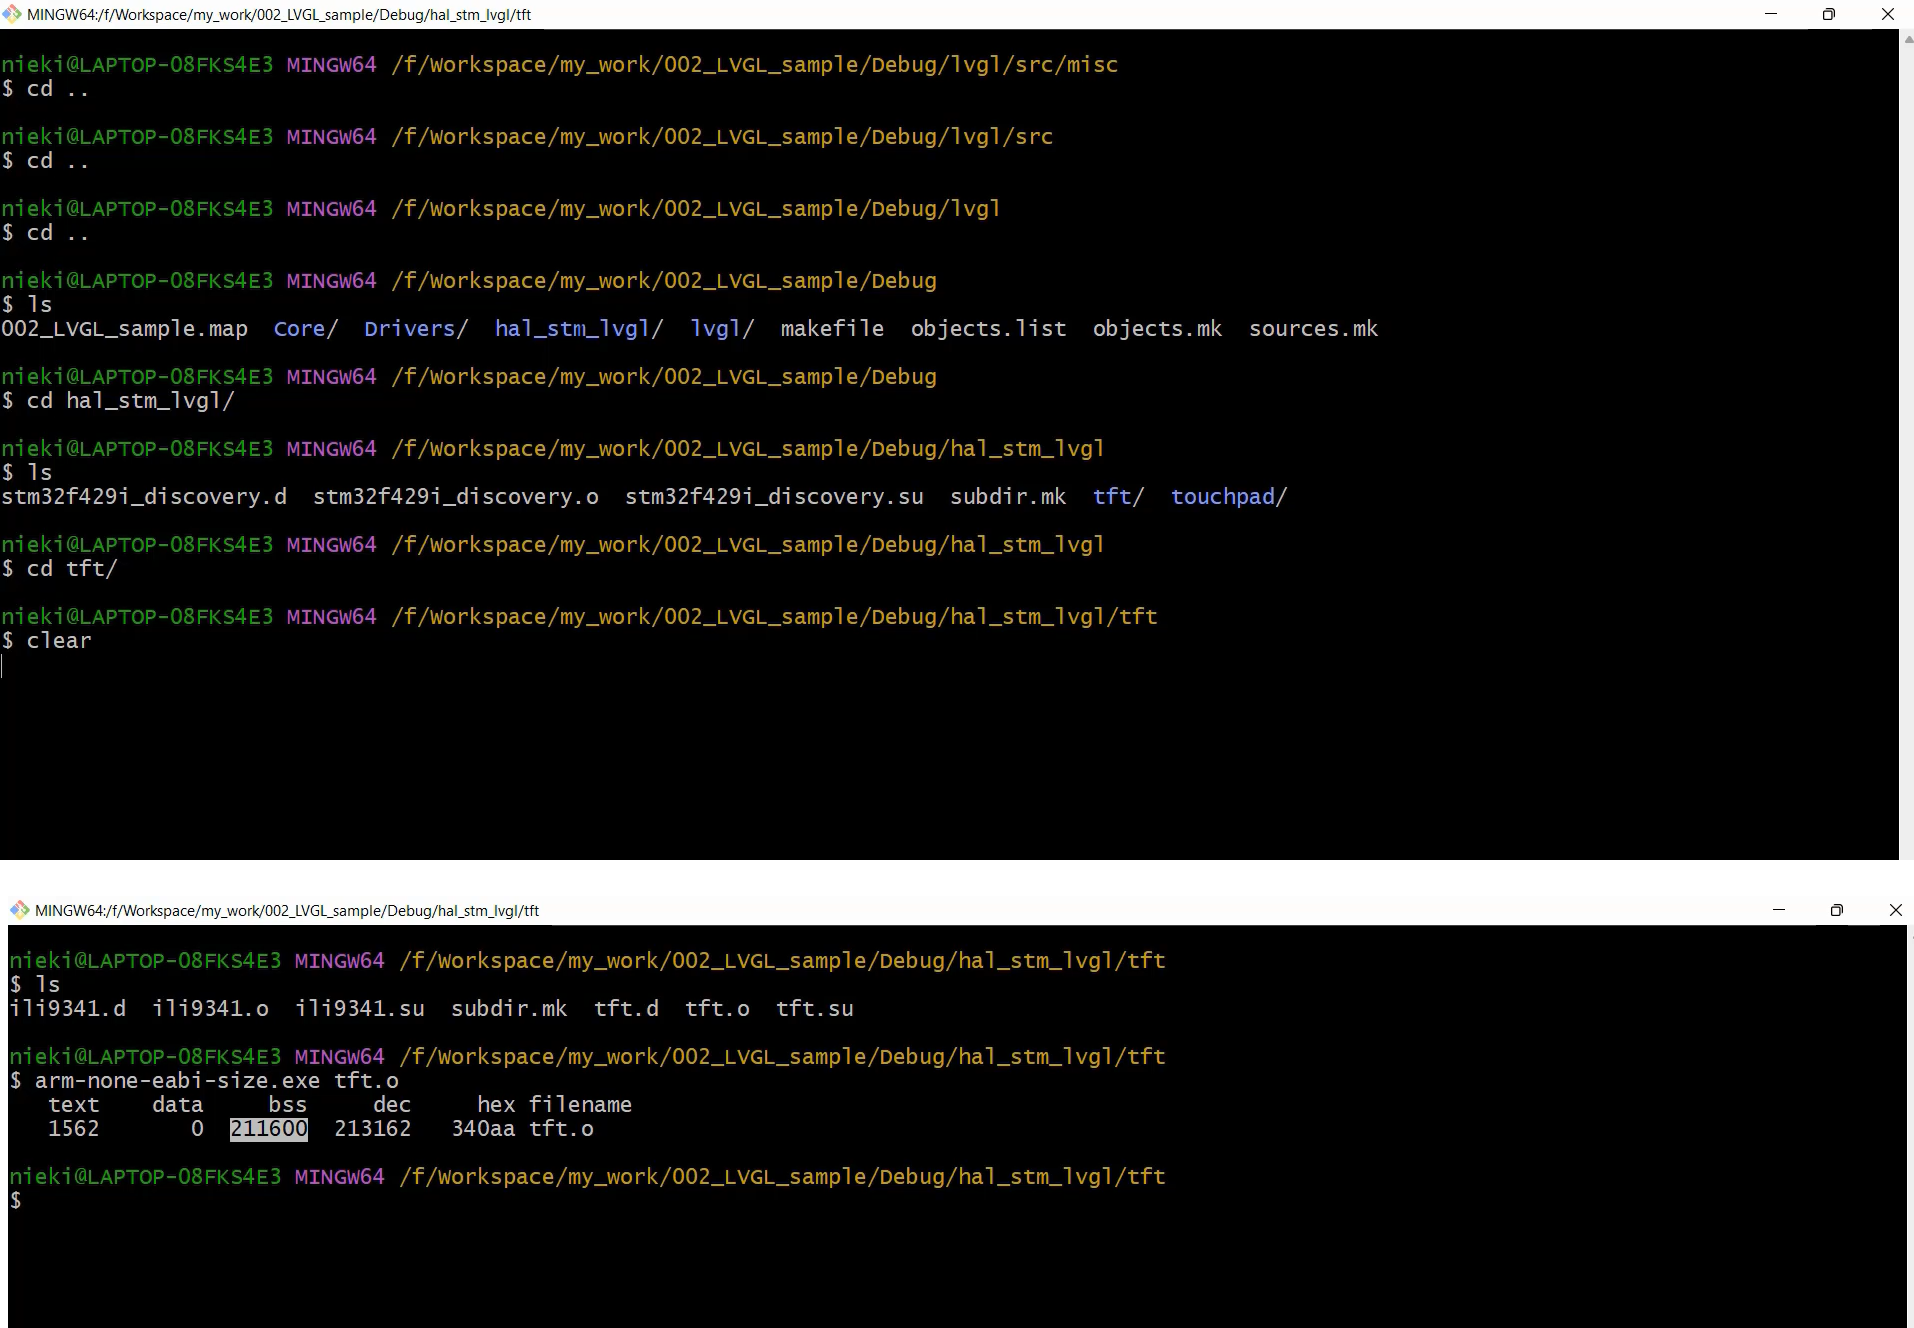
To do this, I’ll go to the command prompt and navigate to my project directory. From there, I’ll access the Debug folder and further navigate into ‘hal_stm_lvgl’. Inside the ‘hal_stm_lvgl’ folder, I’ll locate the ‘tft’ file. And run the command ‘arm-none-eabi-size’ over the ‘tft.o’ file.
As a result, you can see that the ‘.bss’ section of this file alone consumes 211600 kilobytes of RAM(Figure 7).
After that, another significant memory consumption comes from the file ‘lv_mem.o,’ which results in a considerable memory usage.
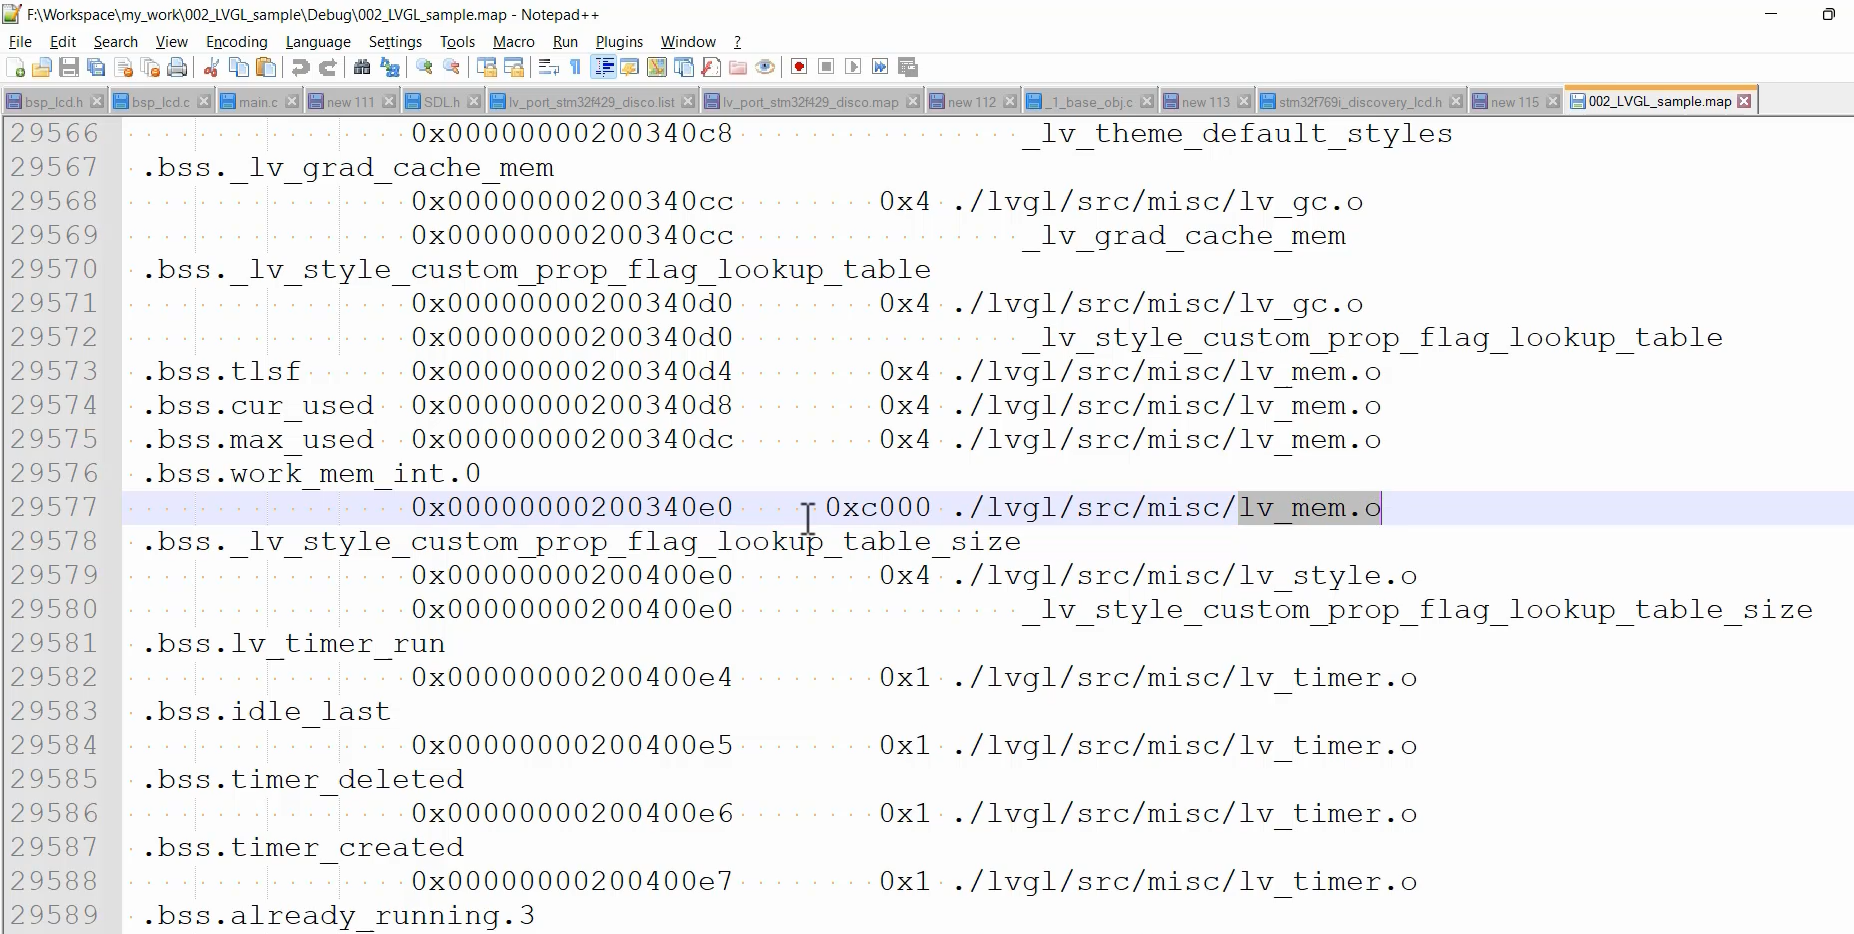
It amounts to ‘C000,’ approximately 49 kilobytes. This memory is consumed by the variable ‘work_mem_int.’
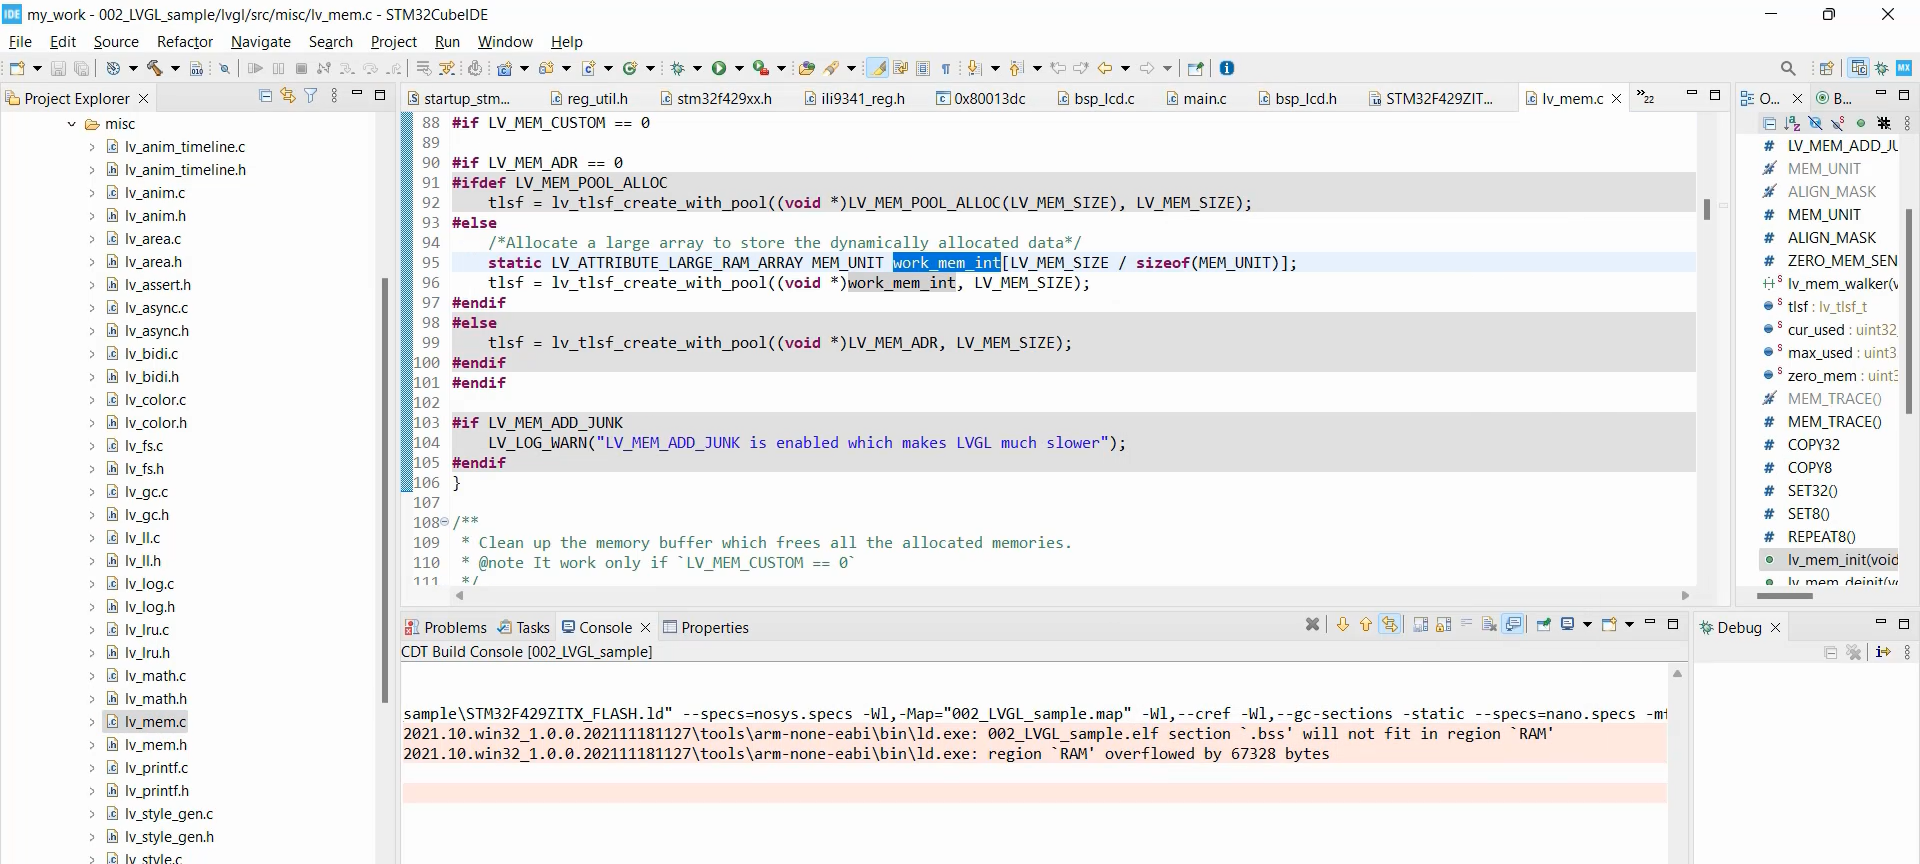
‘work_mem_int’ is a memory pool defined in the ‘lv_mem.c’ file. It essentially represents an array used by LVGL for dynamic memory allocation. The size of this memory pool is determined by the macro ‘LV_MEM_SIZE,’ which is defined in ‘lv_conf.h.’ Presently, it is set to 48 kilobytes, but it can be adjusted as needed. By modifying this macro, you can vary the size of the memory pool, and the ‘lv_mem_alloc()’ function allocates memory from this pool maintained by LVGL.
Now, let’s investigate why ‘tft.c’ is consuming such a significant amount of RAM space.
In ‘tft.c’, as shown in Figure 10, there is a frame buffer (That’s a large array actually). Additionally, there are 2 display buffers, also known as Draw buffers.
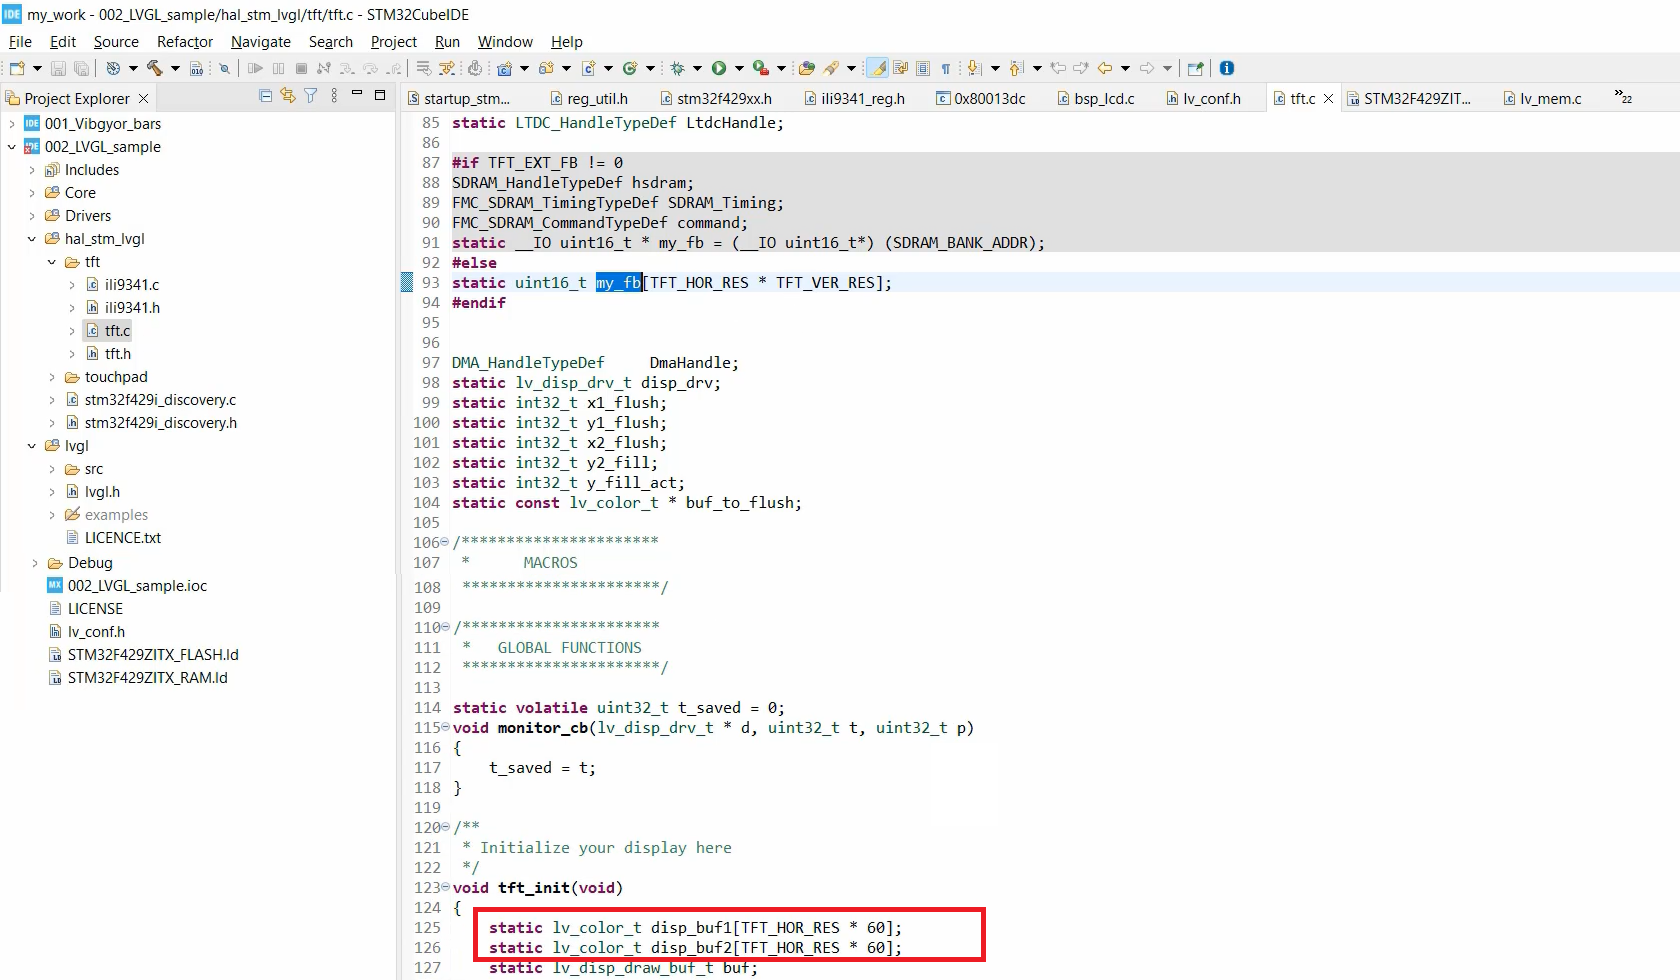
Let’s understand the purpose of Draw buffers.
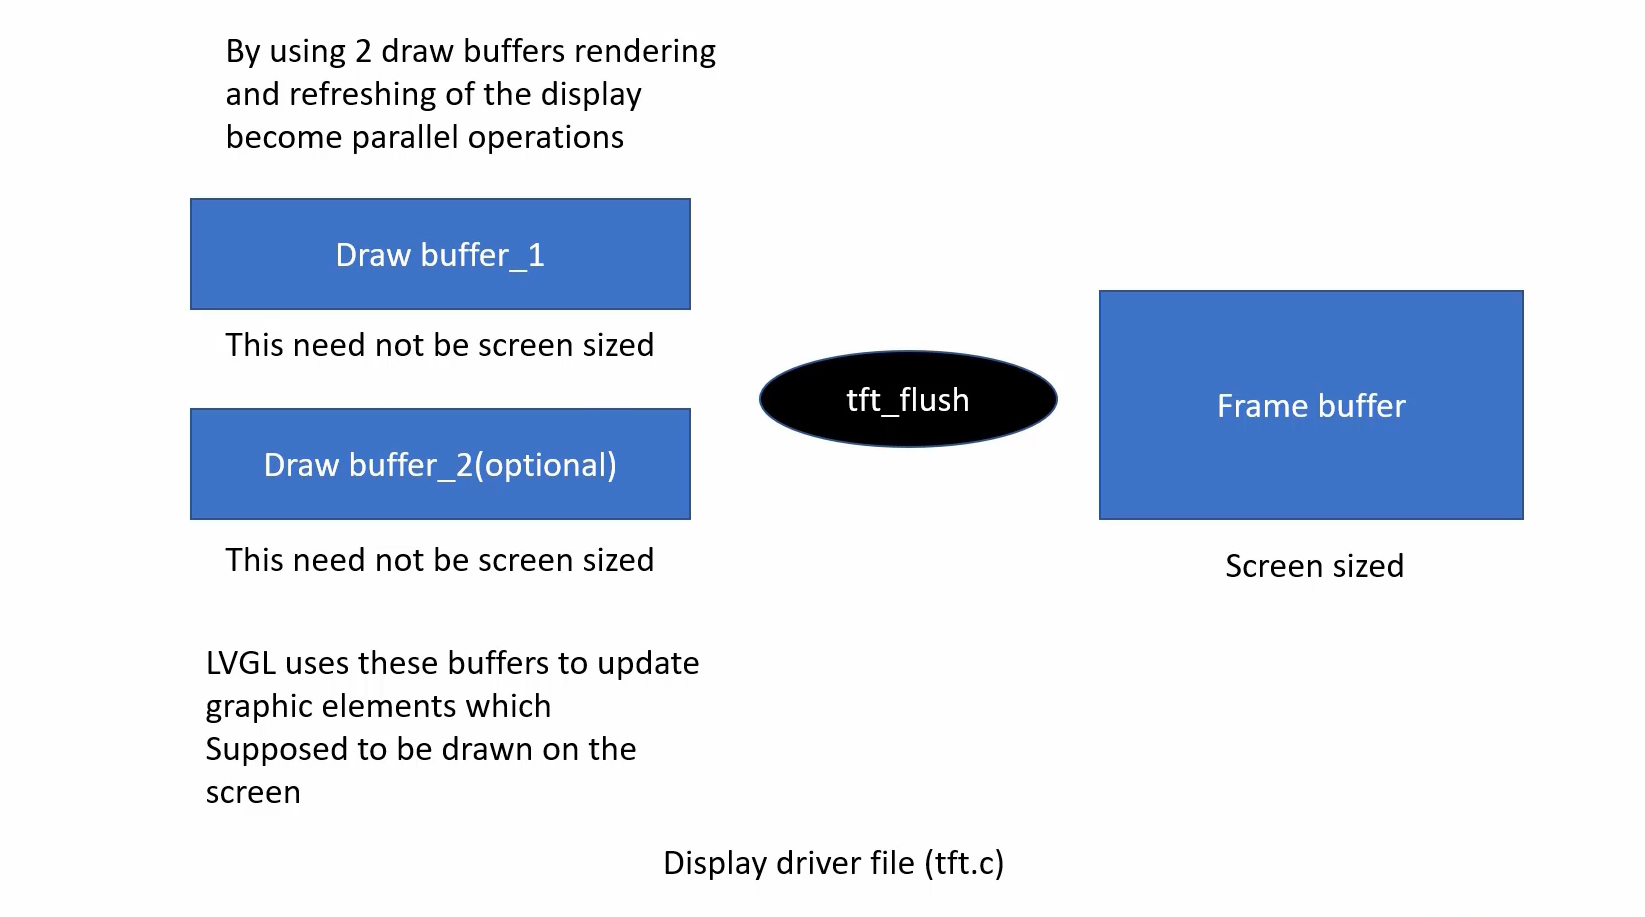
Unlike the frame buffer, the Draw buffers do not need to be screen-sized; they can be of any size, offering more flexibility. These buffers are used by LVGL to update graphic contents and render graphics efficiently.
Here’s how the process works:
- LVGL uses these Draw buffers to render the graphics and update the graphic contents.
- Afterwards, LVGL calls the ‘tft_flush’ function or flush callback of the driver, providing the pointer to the buffer.
- The driver then flushes the contents of the Draw buffer to the frame buffer.
- Subsequently, the data is sent through the LTDC (LCD TFT Display Controller) and displayed on the screen.
In the ‘tft.c’ file, they have utilized two draw buffers, but it’s important to note that the second draw buffer is optional. However, providing two draw buffers allows the rendering and refreshing of the display to occur as parallel operations.
To illustrate this, let’s consider the scenario where only one draw buffer is provided. In this case, LVGL calls the ‘tft_flush’ function when the draw buffer becomes full, which then copies the buffer’s contents to the frame buffer. During this operation, LVGL must wait until it’s finished before modifying the contents of the draw buffer to avoid corruption.
On the other hand, when you provide a second draw buffer while the first buffer is being flushed into the frame buffer, LVGL can already start using draw buffer 2 to render the next graphic element or pixels. This means that LVGL can work on preparing the next set of graphic contents simultaneously with the flushing process, which improves the overall display performance and efficiency.
All of these aspects are detailed in the LVGL documentation.
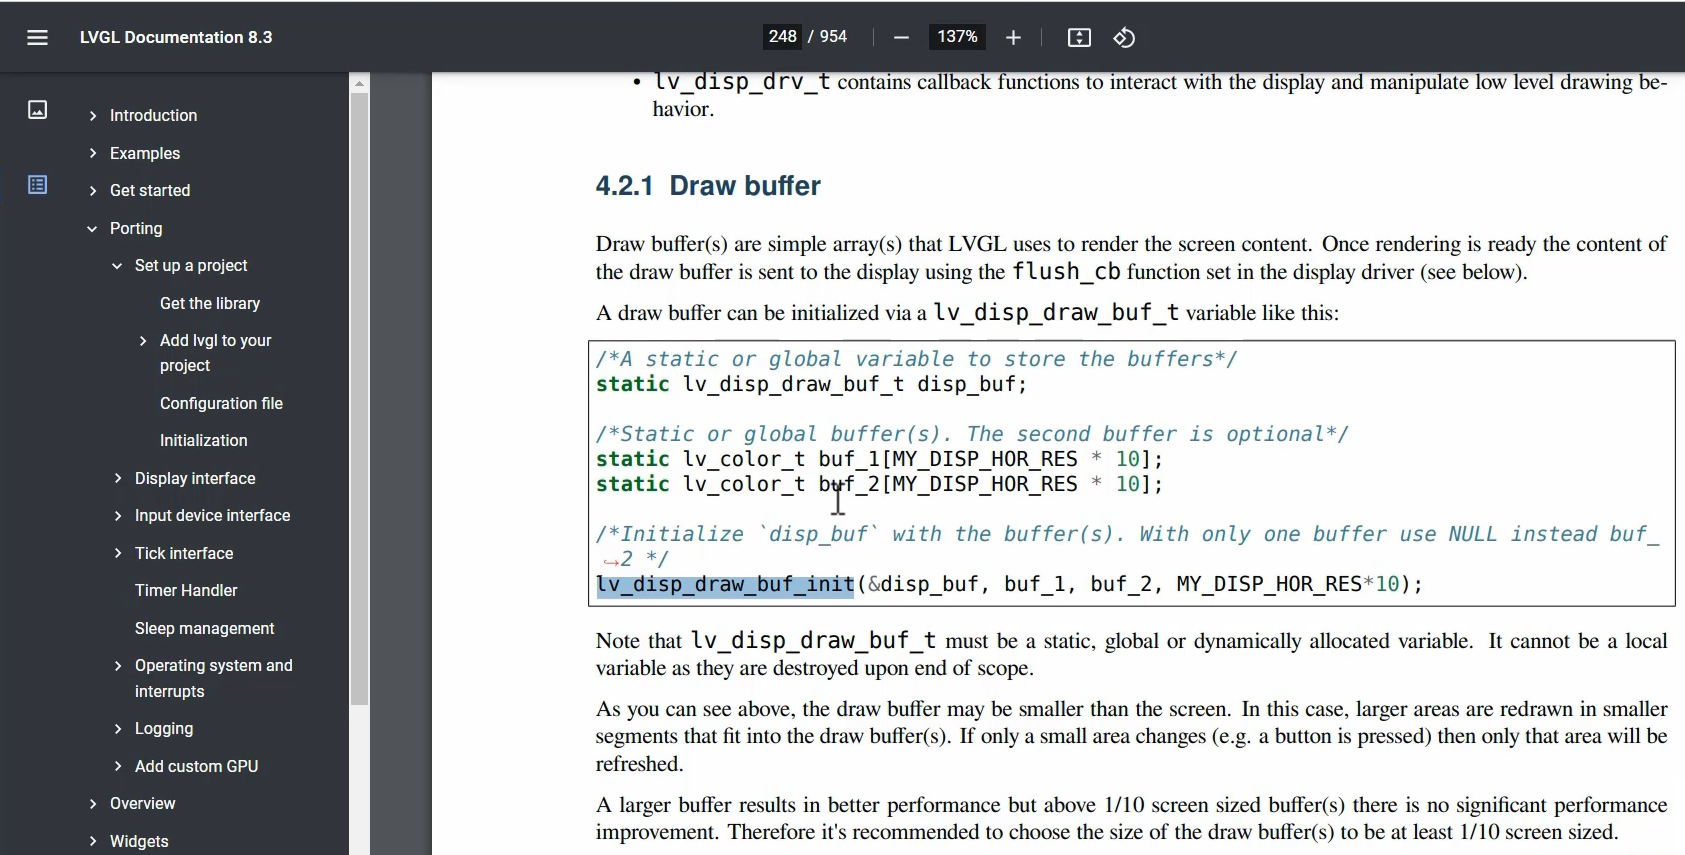
You can see that the draw buffers are they are simple arrays that LVGL uses to render the screen content.
In ‘tft.c,’ the draw buffer pointers are initialized and provided to LVGL. Once the rendering is ready, the content of the draw buffer is sent to the display using the flush_callback set in the display driver.
And they also mentioned that a larger buffer results in better performance but above 1/10 of the screen size, there is no significant performance improvement. For instance, if your screen size is 150 kilobytes, then keeping the draw buffer size as 15 kilobytes (1/10 of the screen size) should be sufficient.
Now, let’s run some LVGL example code.
- Go to the examples directory and locate the ‘lv_examples.h’ header file.
- In your ‘main.c’ file, include the ‘lv_examples.h’ header by adding the following line: include “../../lvgl/examples/lv_examples.h”
- Next, choose a widget example to run. For instance, let’s consider the ‘label’ example. Copy the corresponding function related to the ‘label’ widget.
- Now, call the selected function from the ‘main’ function to execute the ‘label’ example.
- After setting up the example code in your ‘main.c’ file, compile the project and proceed to debug it to check the output and functionality of the LVGL ‘label’ widget.
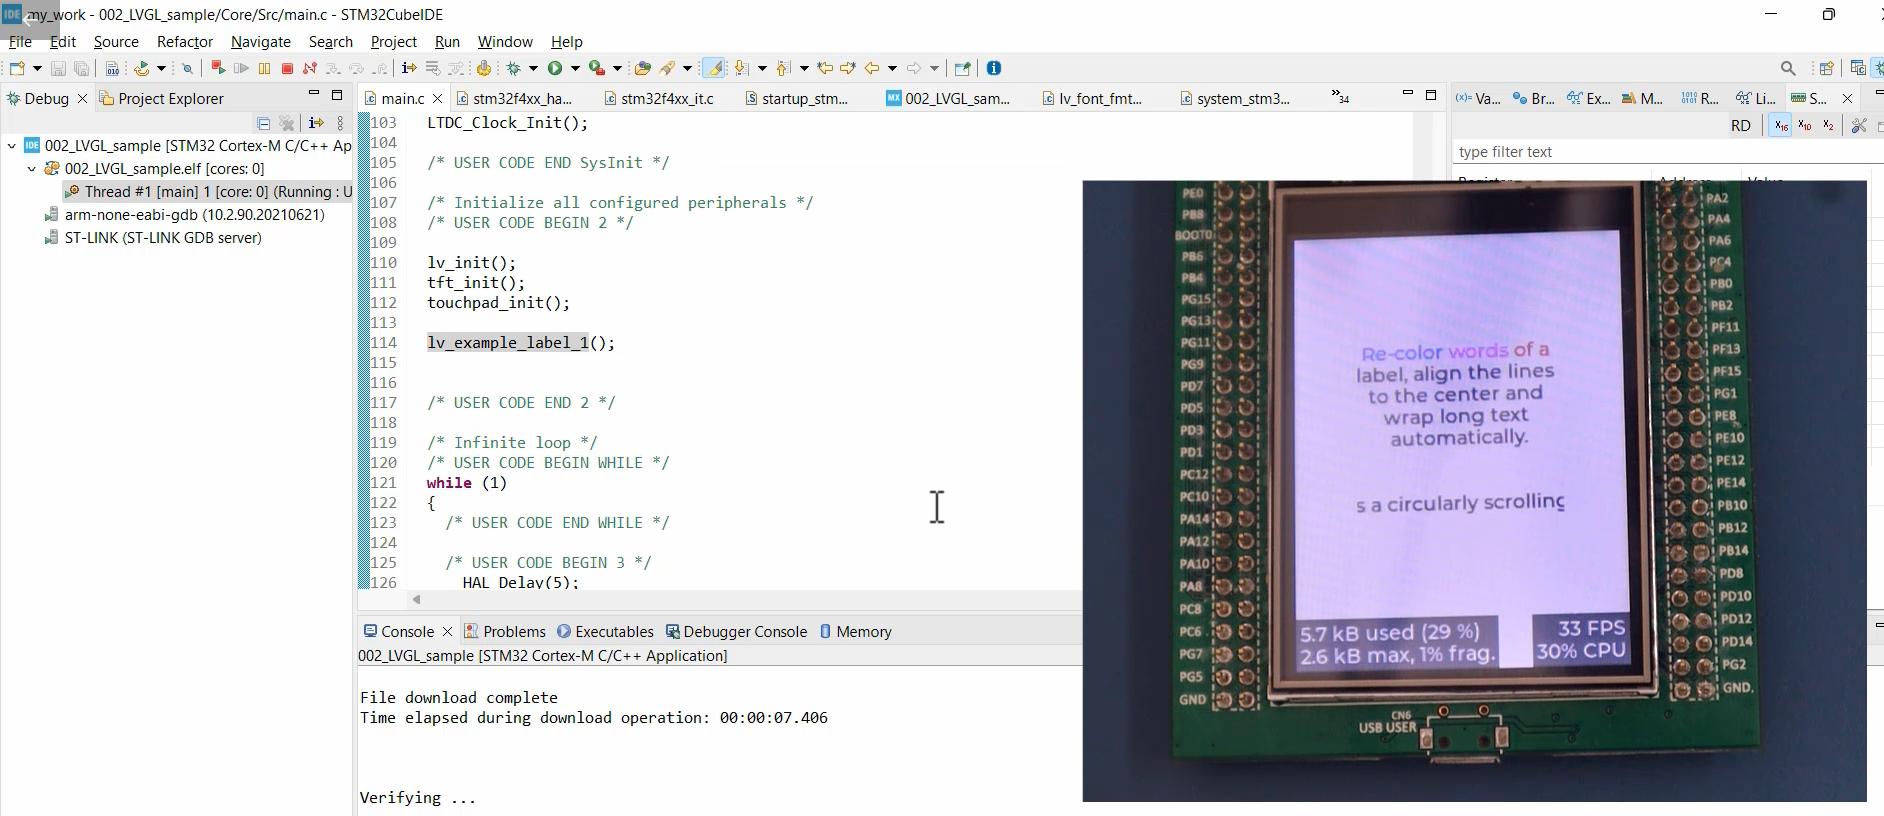
By following these steps, you can successfully run the LVGL ‘label’ widget example and explore the functionality of other widget examples as well. Remember to check the documentation and guide provided with the LVGL library for more detailed instructions and examples.
For example, the calendar example.
Find the ‘calendar’ example function in the ‘lv_examples.h’ header file. The function might be named something like ‘lv_ex_calendar_1()’.
- In your ‘main.c’ file, call the ‘calendar’ example function from the ‘main’ function to execute the calendar example.
- Compile the project, flash it onto your target platform, or run it in the simulator.
- Once the example runs, you can interact with it using the touch functionalities if your target platform supports touch. For the simulator, you can use your mouse to simulate touch inputs.
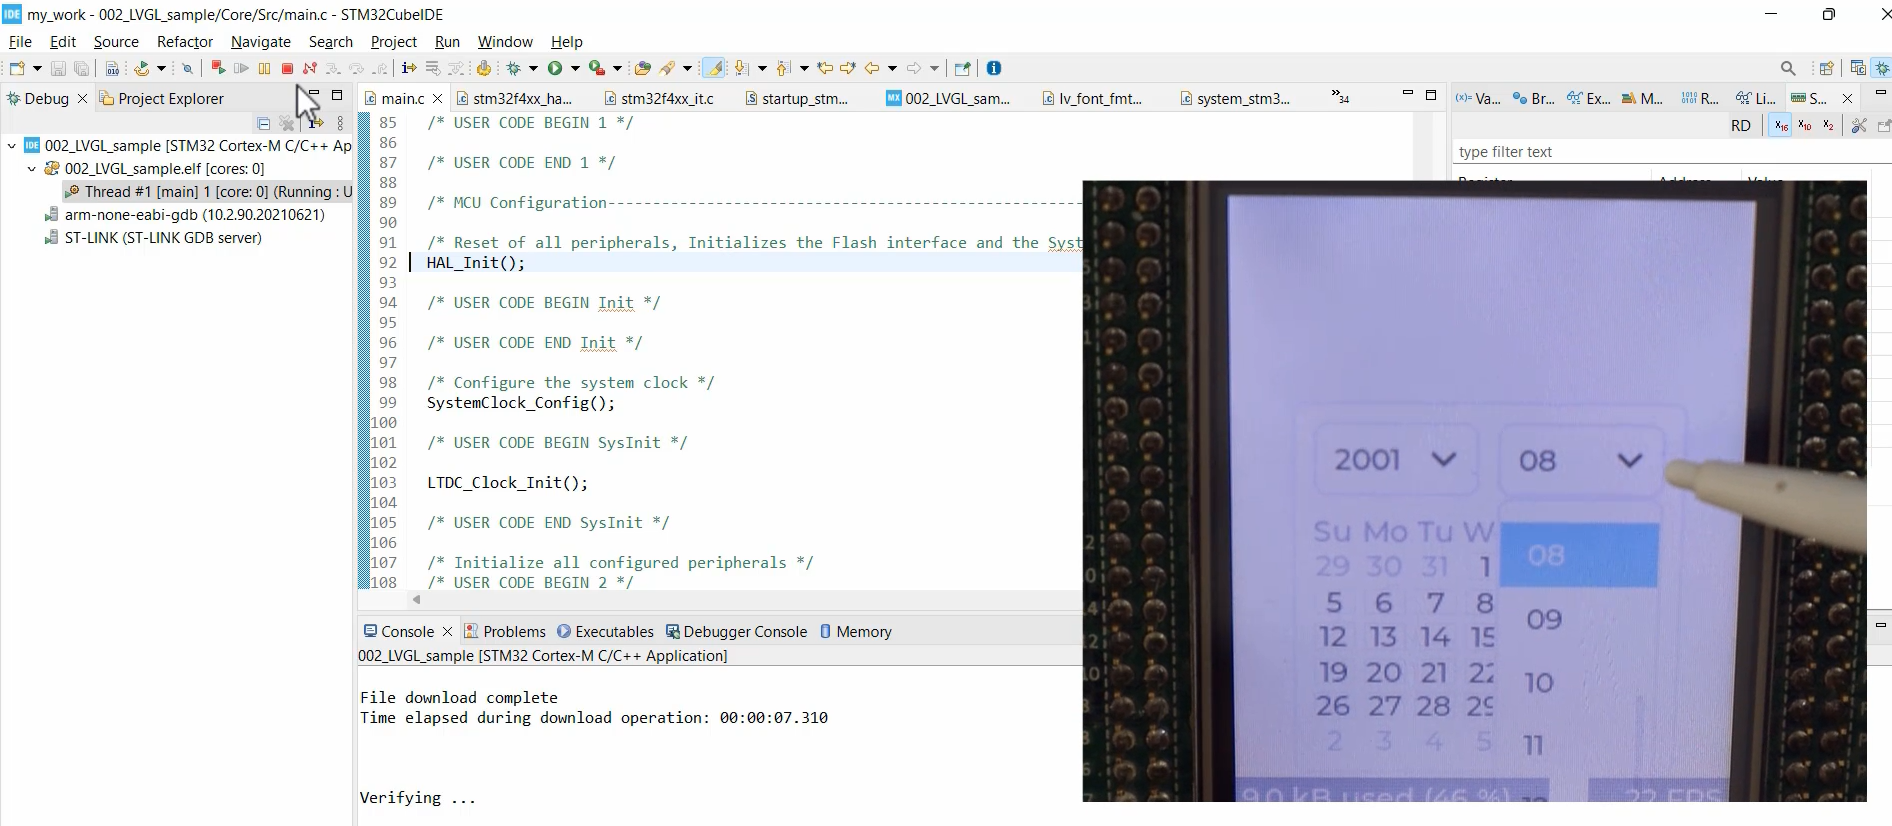
You can experiment with other examples in the simulator or on your target platform by calling their respective functions from the ‘main’ function.
FastBit Embedded Brain Academy Courses
https://fastbitlab.com/course1

