Embedded – ‘Hello World’
In this lecture, let’s write a ‘Hello World’ program for our embedded board based on the ARM Cortex M4 processor.
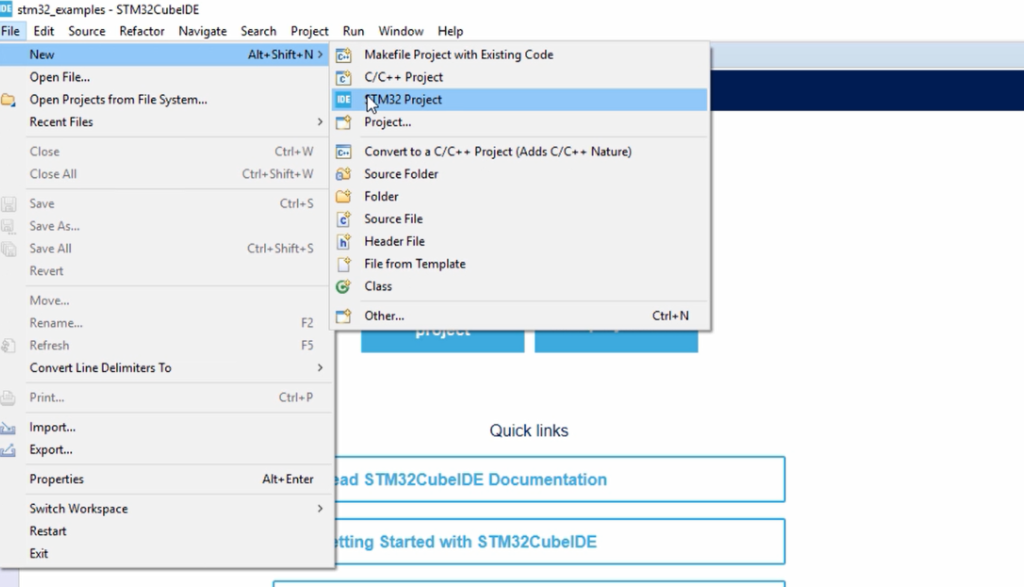
Now we’ll start a new STM32 project. To create a new STM32 project, go to file, go to new, and click on STM32 project, as shown in Figure 1.
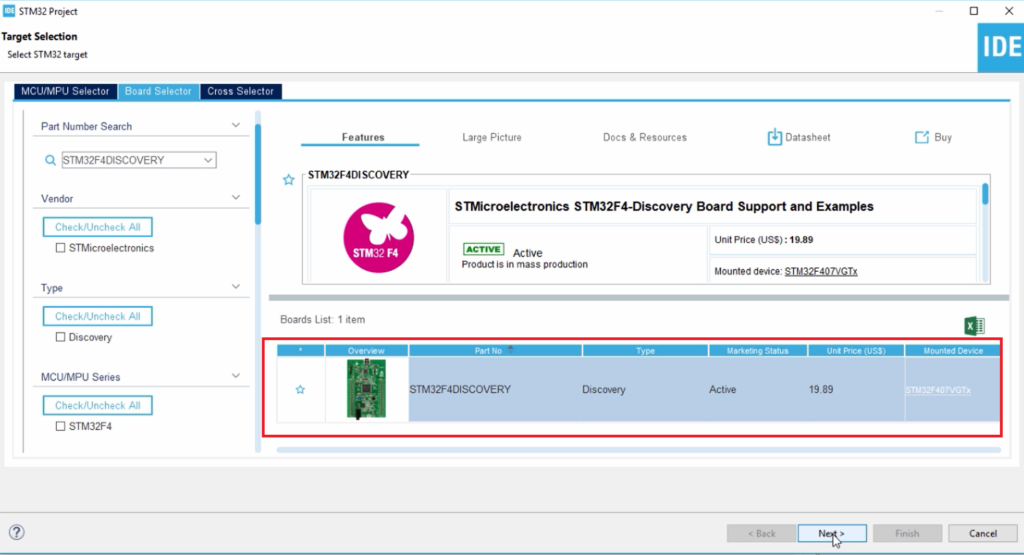
After that, select the STM32F4DISCOVERY option, and click on Next, as shown in Figure 2.
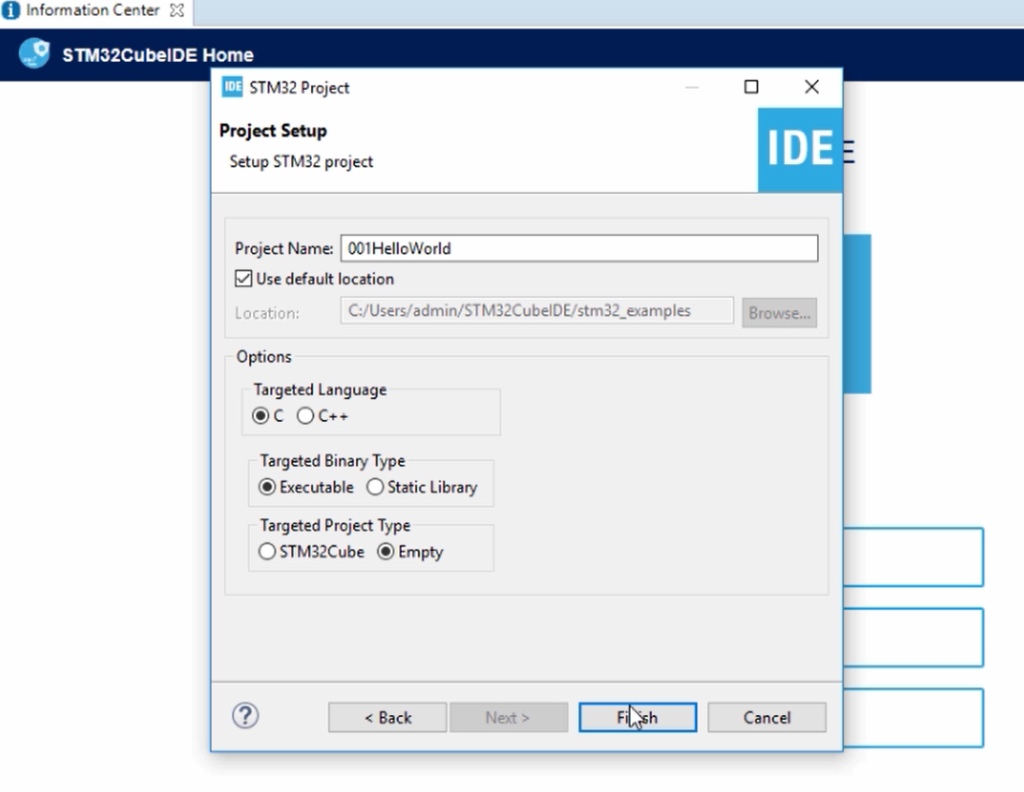
Now you have to give a name for your project. Let me give a 001HelloWorld. After that, the targeted language is ‘C,’ the Targeted Binary type is Executable here, and the targeted project type is select Empty, and after click Finish, as shown in Figure 3.
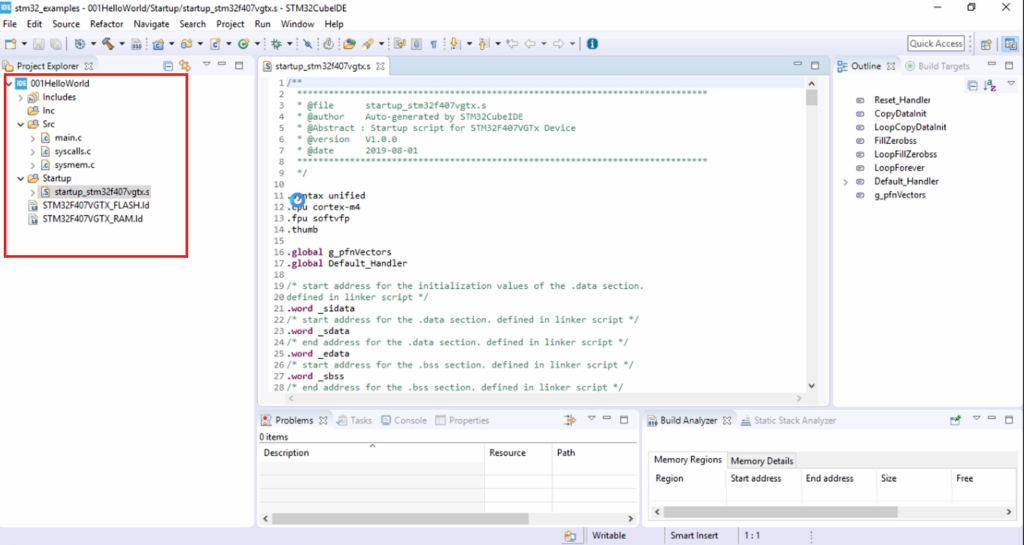
We just created an empty 001HelloWorld project, so it has added a couple of folders here—the Inc folder or include folder, where we keep all our header files of our project. And the source(Src) folder so where we keep all our source codes that is .c files. And here, we can see that the IDE has already added three files: main.c, syscalls.c, sysmem.c.
After that, the important thing here is the startup code for the microcontroller. So, before working with any microcontroller, it doesn’t matter whether it is from ST, or whether it is from TI, or prescale, or whatever it is. So, you should have a startup code for that microcontroller in your project. That is very very important, and so for this article, we are not going to explore the startup code because that would be too early to explore. But, in later sections, I have a plan to introduce writing startup files from scratch.
So, we’ll see that later when we understand more about the microcontroller and the Embedded ‘C’ concept.
The main thing here that you should observe is that it has added the main source file where we will write our code for the microcontroller.
Now, let’s write a program to print the “Hello World” message. For that, let’s use the standard library function printf. Let me write printf(“Hello World\n”); And since it is a standard library function, I write #include<stdio.h>
/**
******************************************************************************
* @file main.c
* @author Auto-generated by STM32CubeIDE
* @version V1.0
* @brief Default main function.
******************************************************************************
*/

#include<stdio.h>
int main(void)
{
printf("Hello World\n");

for(;;);
}
Now you may wonder how this printf would work because we don’t have any display or standard output device which is connected to our embedded board. So, we don’t have any monitor, or we don’t have an LCD, which is connected to our embedded board.
How are we going to see the message output without a display device connected to our board?
For that, there is one solution, and that solution comes from the ARM Cortex Processor itself. Let’s explore that.
Using printf outputs on ARM Cortex M3/M4/M7 based MCUs
- This discussion is only applicable to MCUs based on ARM Cortex M3/M4/M7 or higher processors.
- printf works over the SWO pin(Serial Wire Output) of the SWD interface.
Let’s explore more on this. First of all, this is your board(Figure 5).

You have a board, which is the STM32F4 Discovery board or Nucleo board. And your board has a microcontroller. The microcontroller is STM32F407VG. This is a microcontroller which is produced by ST microelectronics. That microcontroller has a processor inside, which is ARM Cortex M4 Processor.
Now our board also has one more circuitry, which is at the front end of the board and that we call ST link V2 or V1 DEBUG circuitry. That is an ST link onboard debug circuitry. So, by using that debug circuitry, your PC communicates with the board. Through that debug circuitry, you actually write your program to the internal flash of the microcontroller, you read various memory locations of the microcontroller, you make processor run, you make processor stop, so all those debug related activities you do by taking help of this to debug circuitry, which is present on the board. Debug circuitry will talk to your PC over a USB connection.
There is a pin called SWO pin, which is coming from the ARM Cortex M4 processor and it is connected to the debug circuitry. So, the printf works over this SWO pin. Let’s explore further.
For that, I’m going to zoom the ARM Cortex M4 processor. Let’s consider only the ARM Cortex M4 processor(Figure 6).

Inside the ARM Cortex M4 processor, there is a unit or a peripheral called the ITM unit. ITM stands for Instrumentation Trace Macrocell Unit. So, this is inside the processor. The ITM is an optional application-driven trace source that supports printf style debugging to trace operating system and application events, and generates diagnostic system information.
This unit is only available in ARM Cortex M3 or above processors. So, it is not available in the ARM Cortex M0 processor. And to debug the processor, debug means if you want to read the memory location, if you want to read the processor-related register, if you want to make the processor halt, or if you want it to run. So, if you want to do all these activities, then we do that using the debug interface. The debug interface that we are using here is SWD. SWD stands for Serial Wire Debug, which is a two-wire protocol for accessing the ARM debug interface. SWD works over the SWD connector, and that SWD connector has three pins. Two pins are used for debugging, and one pin is used for tracing. Trace means to get the trace related information from the processor.
SWD
- Serial Wire Debug(SWD)is a two-wire protocol for accessing the ARM debug interface.
- It is part of the ARM Debug Interface Specification v5 and is an alternative to JTAG.
- The physical layer of SWD consists of only two lines.
- SWDIO: a bidirectional data line, which carries debug related data.
- SWCLK: a clock driven by the host.
- By using SWD interface should be able to program MCUs internal flash, you can access memory regions, add breakpoints, stop or run the CPU.
- The other good thing about SWD is you can use the serial wire viewer for your printf statements for debugging.
As I said, SWD comes with only two pins used for debugging, but there is one optional pin that we call SWO, which we can use for printf functionality.
SWD and JTAG
There is also another debug interface which is called JTAG. JTAG and SWD’s difference is that JTAG needs more pins than SWD.
JTAG was the traditional mechanism for debug connections for ARM7 or ARM9 family, but with the Cortex-M family, ARM introduced the Serial Wire Debug interface. SWD is designed to reduce the pin count required for debug from the 4 used by JTAG(excluding GND) down to 2. In addition, SWD interface provides one more pin called SWO which is used for Single Wire Viewing(SWV), which is a low cost tracing technology.
Let’s move forward. If I zoom this ITM unit further, you see a FIFO, or you can call it a buffer or a register. It’s a hardware buffer that is there inside the ITM unit.
Now all you need to do is write the printf data into this FIFO. So, that FIFO is connected to the SWO pin, which is coming out of the processor, and it is coming all the way to your debug circuitry, which is present on the board.
The moment your printf writes into this FIFO, that messages will come over the SWO pin, and you then capture it. So, there is a provision to capture this SWO pin in the IDE.
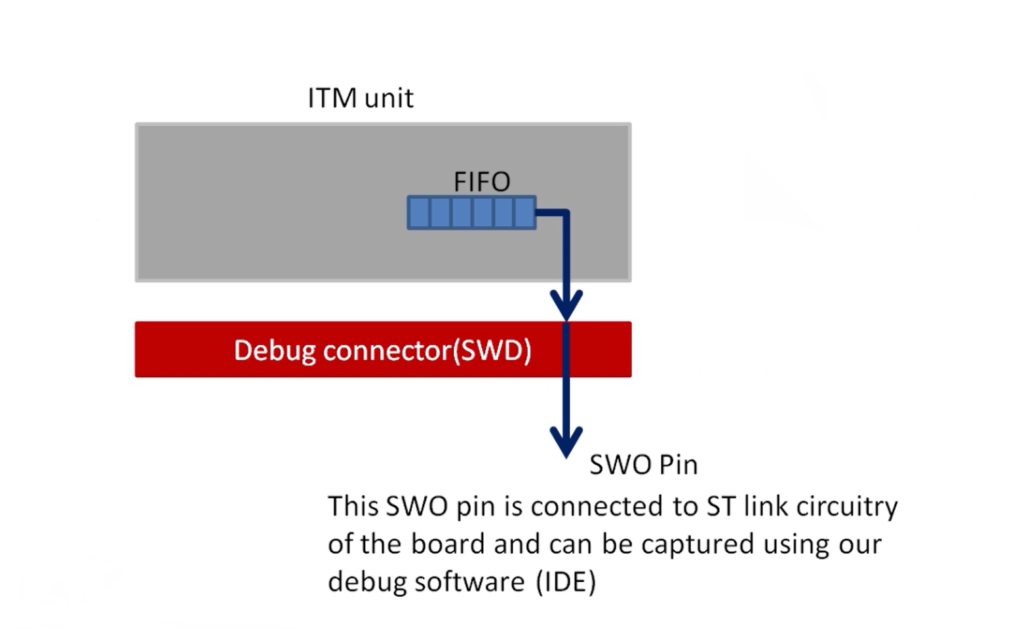
Remember that not all IDE support this feature of capturing SWO pin. But fortunately, STM32Cube IDE and true studio, so those IDEs actually support these functionalities. SWO pin is connected to the ST link circuitry of the board and can be captured using our debug software.
This is the idea behind how printf works in the ARM Cortex MX processor. So, there is an ITM unit, and it has a FIFO, and your printf somehow should write into that FIFO, and that FIFO is connected to the SWO pin, and through that you get that message back to the IDE.
Now in our application, you have to do some settings or add some code to make your printf writes into that ITMs FIFO.
For that, you have to add a small code snippet. In the syscalls.c, the implementation of printf like feature using ARM Cortex M3/M4/M7 ITM functionality. This function will not work for ARM M0/M0+. If you are using Cortex M0, then you can use the semihosting feature of openOCD.
And this is a code that we added and which actually writes into that FIFO.
/* Includes */
#include <sys/stat.h>
#include <stdlib.h>
#include <errno.h>
#include <stdio.h>
#include <signal.h>
#include <time.h>
#include <sys/time.h>
#include <sys/times.h>


/////////////////////////////////////////////////////////////////////////////////////////////////////////
// Implementation of printf like feature using ARM Cortex M3/M4/M7 ITM functionality
// This function will not work for ARM Cortex M0/M0+
// If you are using Cortex M0, then you can use semihosting feature of openOCD
/////////////////////////////////////////////////////////////////////////////////////////////////////////


//Debug Exception and Monitor Control Register base address
#define DEMCR *((volatile uint32_t*) 0xE000EDFCU )

/* ITM register addresses */
#define ITM_STIMULUS_PORT0 *((volatile uint32_t*) 0xE0000000 )
#define ITM_TRACE_EN *((volatile uint32_t*) 0xE0000E00 )

void ITM_SendChar(uint8_t ch)
{

//Enable TRCENA
DEMCR |= ( 1 << 24);

//enable stimulus port 0
ITM_TRACE_EN |= ( 1 << 0);

// read FIFO status in bit [0]:
while(!(ITM_STIMULUS_PORT0 & 1));

//Write to ITM stimulus port0
ITM_STIMULUS_PORT0 = ch;
}

/* Variables */
//#undef errno
extern int errno;
extern int __io_putchar(int ch) __attribute__((weak));
extern int __io_getchar(void) __attribute__((weak));

register char * stack_ptr asm("sp");

char *__env[1] = { 0 };
char **environ = __env;


/* Functions */
void initialise_monitor_handles()
{
}

int _getpid(void)
{
return 1;
}

int _kill(int pid, int sig)
{
errno = EINVAL;
return -1;
}

void _exit (int status)
{
_kill(status, -1);
while (1) {} /* Make sure we hang here */
}

__attribute__((weak)) int _read(int file, char *ptr, int len)
{
int DataIdx;

for (DataIdx = 0; DataIdx < len; DataIdx++)
{
*ptr++ = __io_getchar();
}

return len;
}

__attribute__((weak)) int _write(int file, char *ptr, int len)
{
int DataIdx;

for (DataIdx = 0; DataIdx < len; DataIdx++)
{
//__io_putchar(*ptr++);
ITM_SendChar(*ptr++);
}
return len;
}

int _close(int file)
{
return -1;
}


int _fstat(int file, struct stat *st)
{
st->st_mode = S_IFCHR;
return 0;
}

int _isatty(int file)
{
return 1;
}

int _lseek(int file, int ptr, int dir)
{
return 0;
}

int _open(char *path, int flags, ...)
{
/* Pretend like we always fail */
return -1;
}

int _wait(int *status)
{
errno = ECHILD;
return -1;
}

int _unlink(char *name)
{
errno = ENOENT;
return -1;
}

int _times(struct tms *buf)
{
return -1;
}

int _stat(char *file, struct stat *st)
{
st->st_mode = S_IFCHR;
return 0;
}

int _link(char *old, char *new)
{
errno = EMLINK;
return -1;
}

int _fork(void)
{
errno = EAGAIN;
return -1;
}

int _execve(char *name, char **argv, char **env)
{
errno = ENOMEM;
return -1;
}
So, in the syscalls.c you should identify a function called write. In the write function, you have to comment out this line _io_putchar(*ptr++), so instead of that, call this function ITM_SendChar and give the argument *ptr++, as shown below.
So, instead of calling this, you are just calling our ITM message sending function. That’s all you have to do.
__attribute__((weak)) int _write(int file, char *ptr, int len)

{

int DataIdx;

for (DataIdx = 0; DataIdx < len; DataIdx++)

{

//__io_putchar(*ptr++);

ITM_SendChar(*ptr++);

}
return len;
}
After that, you are ready to test this application.
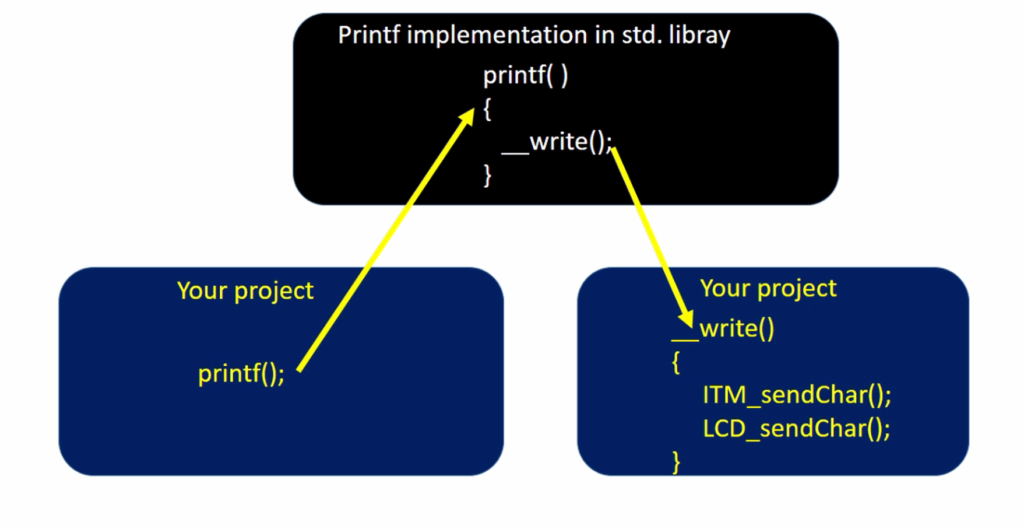
So, what’s happening here is, when you call a printf function which is a standard library function. So, the printf function is implemented in the ‘C’ standard library. The printf implementation then calls a lower-level function called write. That write is actually implemented in syscalls.c. And in that write, we call our API ITM_SendChar to populate the ITMs FIFO. And that’s how we actually divert the printf to the ITM unit, and then we get the trace through the SWO pin.
Suppose you have an LCD, you can call LCD_SendChar here. If you have UART, then you can call UART_SendChar here. After that, to test this application, you have first to compile it, So that is what we call cross-compilation.
FastBit Embedded Brain Academy Courses
Click here: https://fastbitlab.com/course1

